


Practice Guide: Monitoring for Soil, Plant and Landscape Health
How to use monitoring to guide good farm decisions
Published October 2026
In this guide
- What are the benefits of monitoring?
- Farmers who are tracking their soil, plant and landscape health
- How to start monitoring
- Choosing monitoring practices
- Monitoring soil health
- Monitoring plant health
- Monitoring landscape health
- How to interpret monitoring results
- Using monitoring data to inform decision making
- Further learning
Good soil, plant and landscape health monitoring practices underpin good decision-making on farms. Regular monitoring practices can provide opportunities for informed decisions, reduce risk, increase profit and improve confidence.
Monitoring is a system for tracking indicators and trends in soil health, plant health and landscape health over time. Monitoring data can give an early sign of declining soil or ecosystem health. It can also be used to indicate if soil health improvement strategies are on track or if your strategies need to be adapted.
This monitoring practice guide steps through how to decide what to measure and how to start monitoring soil, plant and landscape health to guide your farm decision-making. It is designed to support a habit of curiosity, giving you practical ways to make monitoring part of the way you already farm. It shares three farmers’ monitoring practices to help you understand some of the ways monitoring can be used on farm. As with any practice, you should think about how it fits within your farm’s unique context.

Important: This guide is designed to provide general information only. It is not tailored to the context of any individual farm, person or business, and does not constitute advice. Before using the information, you should carefully evaluate its accuracy, currency, completeness and relevance for your purposes, and consider seeking advice from appropriate professionals who have taken into account your individual circumstances and objectives. As a nonprofit dedicated to supporting farmers, we work hard to ensure our information is useful and accurate. However, Soils for Life accepts no liability arising from any use or release of information in, or referred to in or linked to this guide, or any error, inaccuracy or omission.
Supported by
This guide was produced with funding from James N Kirby Foundation. We also acknowledge and thank the case study farmers profiled in this guide for their generosity in sharing their stories, knowledge and experience. Soils for Life remains solely responsible for all content, and the views expressed do not necessarily reflect those of the funder or advisers.
What are the benefits of monitoring?
Farmers who monitor can more confidently choose practices and inputs to improve soil and landscape health and build resilience.
Learning how to monitor allows you to track and tell the story of your soil and landscape health and management. It is a skill that helps you spot patterns, track changes and build confidence that your farm decisions are having a real impact on the health of your soil, plants and landscape. Weaving soil, plant and landscape monitoring practices into your operation is about paying attention in a more deliberate way, capturing what you see and letting the land (and the data) tell you what’s working.
The more you notice and track, the more confident you can be in adjusting practices, reducing inputs and sharing the story of your farm with your customers and community.
How monitoring helps
Farmers who regularly monitor their soil, plants and landscapes find it helps them in a number of practical ways.
- Improving decision-making and reducing risk when implementing new practices
- Targeting more efficient use of farm inputs
- Evaluating progress towards farm business, soil and landscape goals
- Identifying soil constraints that might be limiting production or increasing the risk of degradation
- Preparing for or accessing new markets that value evidence of soil and landscape stewardship.
Farmers who are tracking their soil, plant and landscape health
Meet the farmers! These farmers have contributed to this practice guide, sharing how they monitor soil, plant and landscape health within their own systems. They share the benefits that monitoring has for their farm landscapes and businesses.
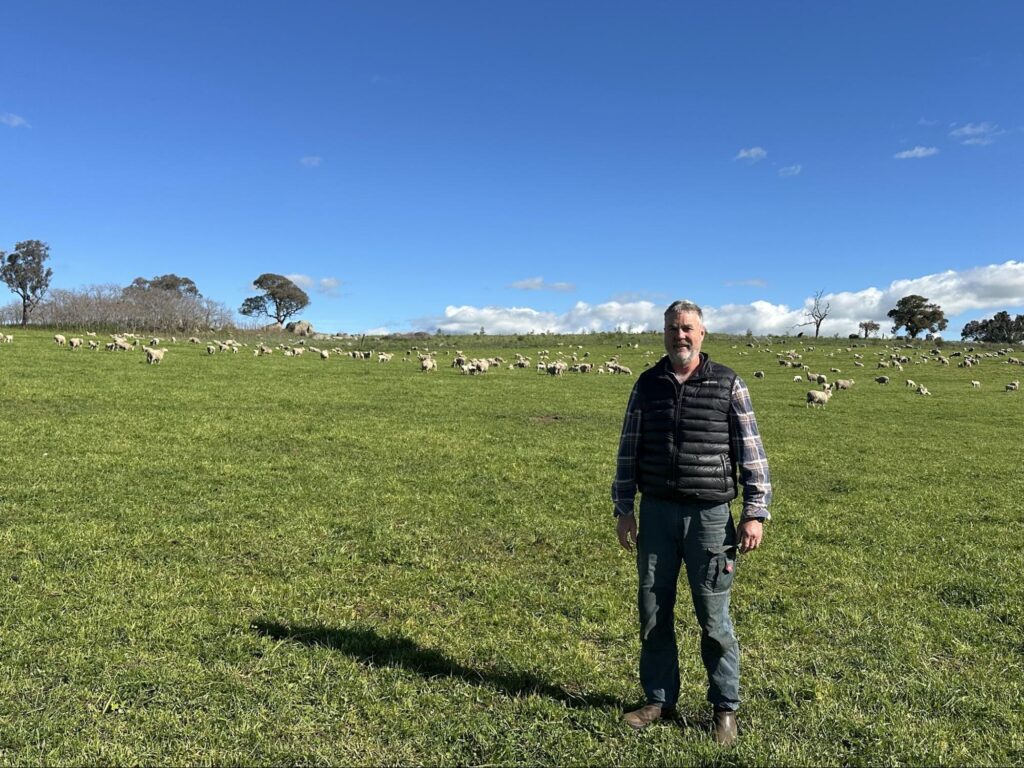
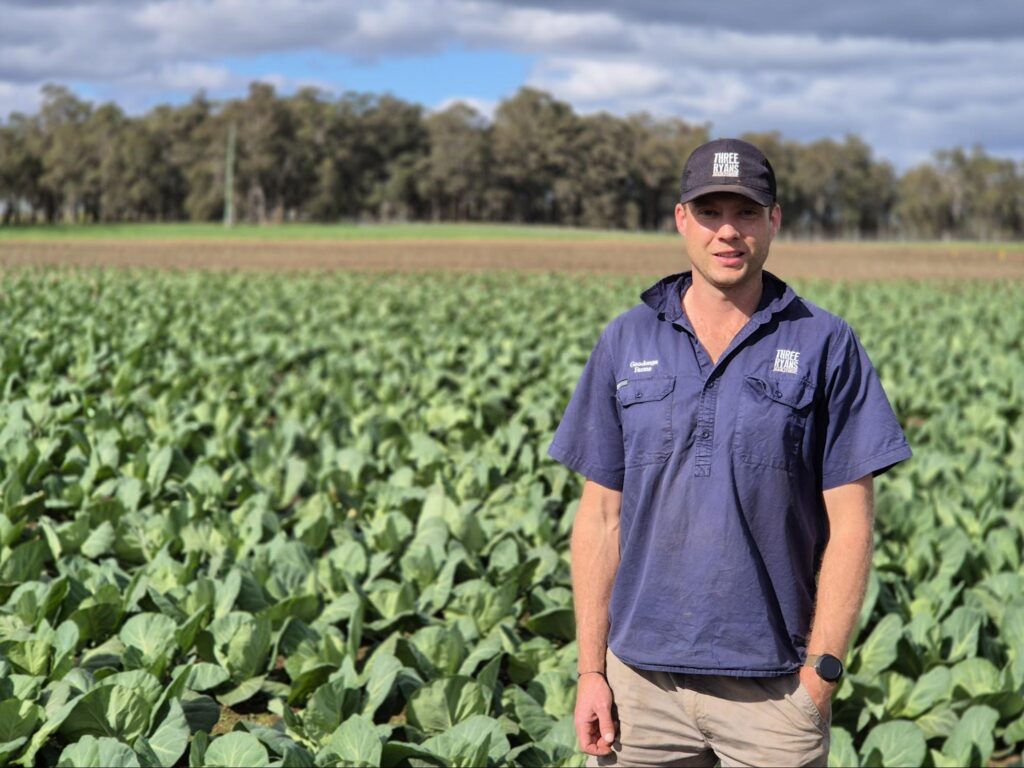
Michael Baldry
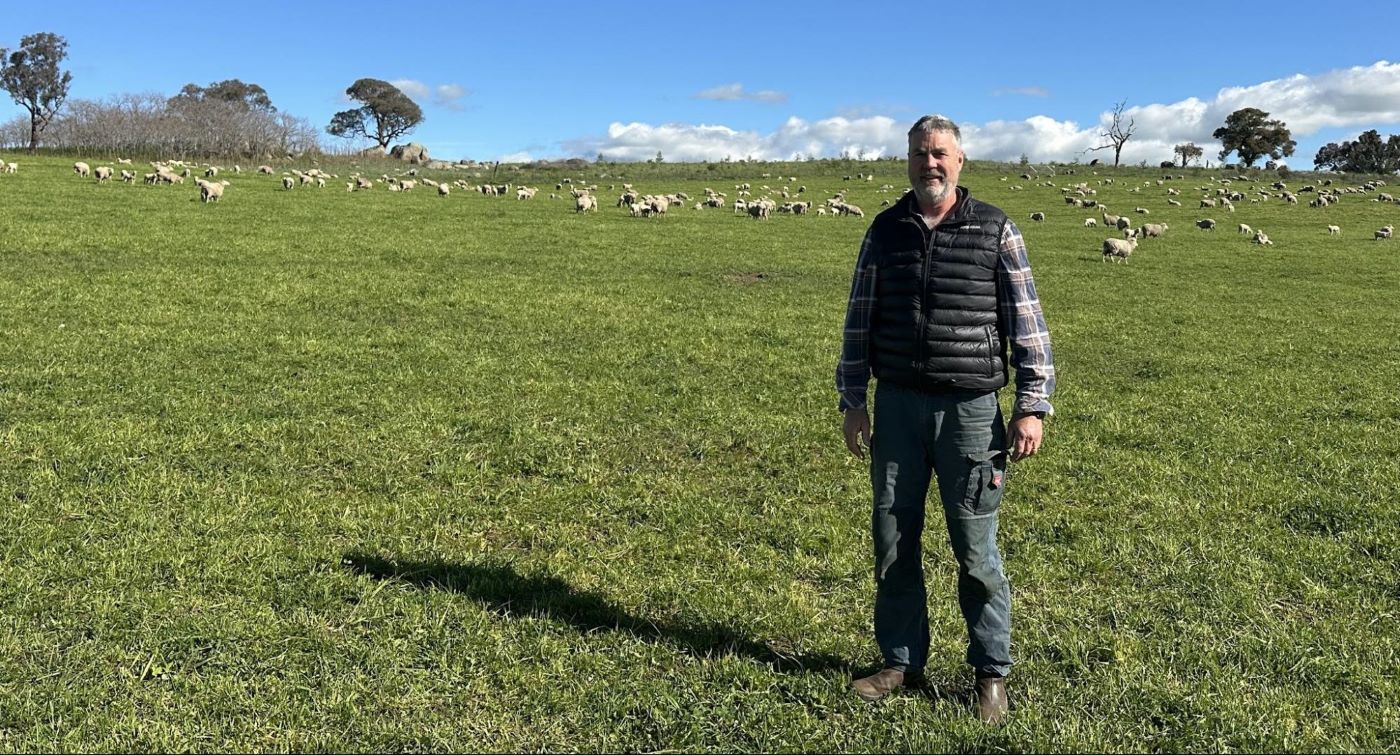
Michael Baldry’s family has been farming in the Harden district for five generations. Michael studied agricultural economics and worked in share trading before inheriting Collingwood in 2003, when he leased the farm to his brother and continued his career. He returned in 2014, at which point he started managing the operation using the Holistic Management decision making framework and changing fencing to improve grazing management.
Michael began transitioning the farm from cropping back to pastures by sowing a series of winter and summer grazing annual cover crops in the cropping paddocks before putting these paddocks back into perennial pastures. The plan is to convert the whole property to perennial pastures by 2027. The most underperforming pasture (approximately 25 ha) will be renovated annually using a short cover crop cycle to resow a mix of perennials. Michael plants a 14-species perennial pasture mix, using varieties that grow more into the summer to suit their pastures that have a short graze period and a long recovery period.
Excited by the obvious improvements from his management practices, Michael has been implementing a soil health monitoring program since 2020 and is planning to use the monitoring data to show trends, help identify underperforming paddocks and inform the plan for improving them. He is also curious to see if cover crops have influenced compaction or soil health.
Location: Wiradjuri Country, Harden, New South Wales
Regional Climate: Temperate, hot summers, cool winters; no dry season
Average Annual Rainfall: 620 mm
Property Size: 840 ha
Elevation: 460–510 m
Social Structure: 5th generation family farm
Enterprise Type: 800 ha of perennial-based pastures for cattle and sheep grazing; cropping 100 ha at present, which includes a rotation of 40 ha of winter and summer annual cover crops, with winter oats and vetch harvested if the season allows
Monitoring practices: Soil physical health monitoring using the HASH method, Soil chemistry laboratory testing, Soil biology DNA testing
Soils: Chromosols; mostly sandy clay loam, brown top soils and red sub soils, granite-based
Gillian Sanbrook
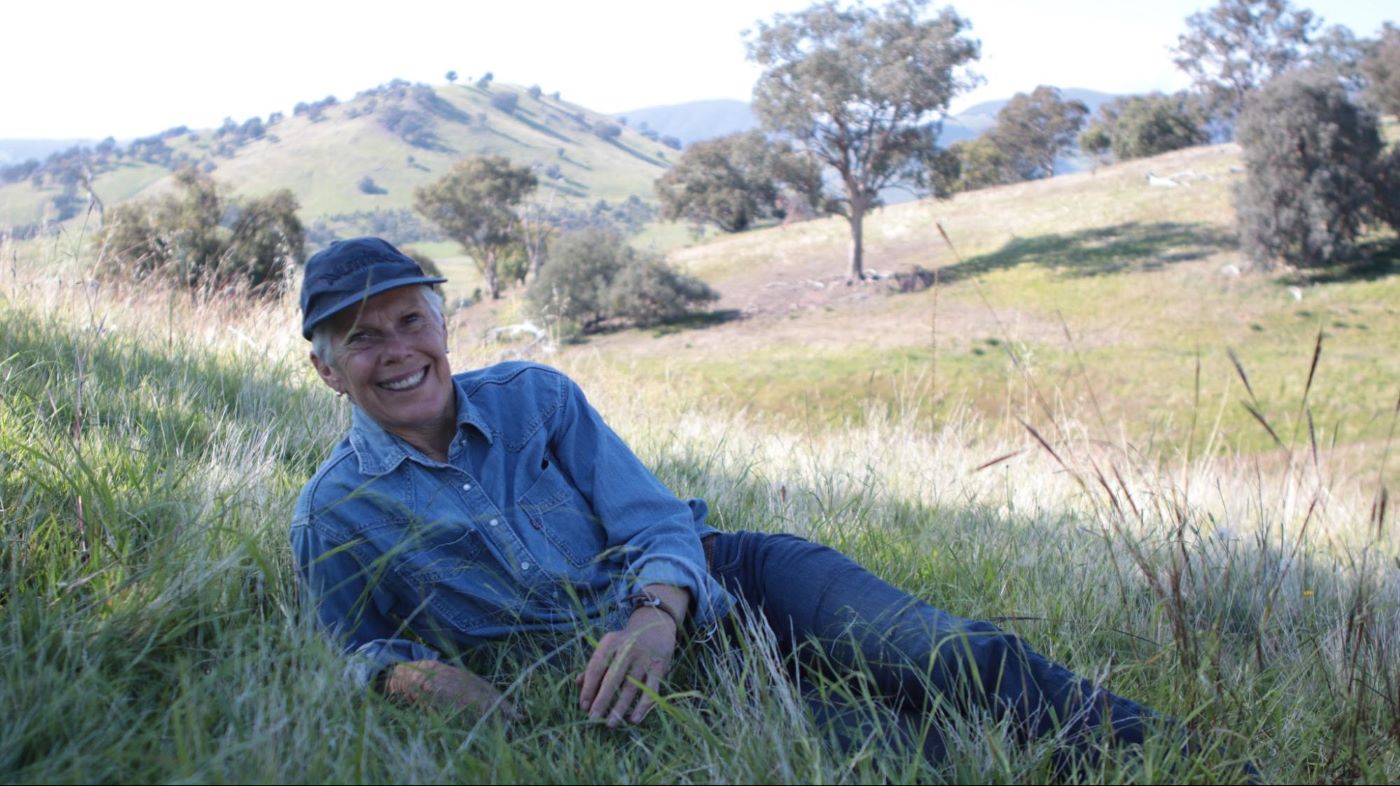
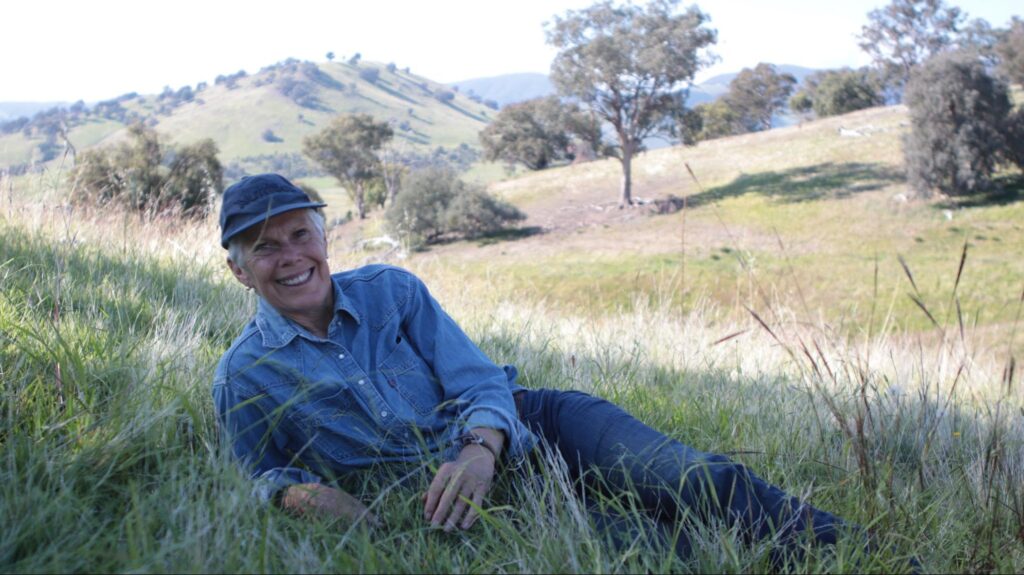
Gillian Sanbrook purchased Bibbaringa in 2007 during the Millennium drought. She initially grazed a breeding herd on the property, but persistent variable climatic conditions led her to change to trading cattle in 2016. For the past five years, Gillian has agisted cattle instead, making it easier to get stock off the property when conditions are unsuitable for grazing.
When Gillian came to Bibbaringa she initiated a full Holistic Management planning program, which involved upgrading the stock water system, fencing and paddock sub-divisions, planting trees, allowing plants to grow and achieving 100% ground cover. She manages the cattle using planned rotational grazing, which allows for recovery of plants from 100 to 240 days, depending on the conditions. The livestock are managed as a tool to regenerate the landscape.
Gillian began monitoring soil, plant and landscape health in the 1990s on a 14,000 ha Merino property north of Jerilderie after training in Holistic Management decision-making. When she came to Bibbaringa, Gillian began implementing annual Holistic Management monitoring to support her planning program. She uses this information to make decisions, observe seasonal and management changes and stay connected to the landscape. Monitoring provides her with evidence of the ecological improvements she observes.
Location: Wiradjuri Country, Bowna, New South Wales
Regional Climate: Temperate, winter rainfall, warm summers
Average Annual Rainfall: 650 mm
Property Size: 972 ha
Elevation: 240–600 m
Social Structure: Sole owner/manager
Enterprise Type: Agisting cattle
Monitoring practices: Soil physical health monitoring using the HASH method, Feed budgeting, Bird surveys with BirdLife Australia, Dung beetle counts
Soils: Granite soils
Jake Ryan
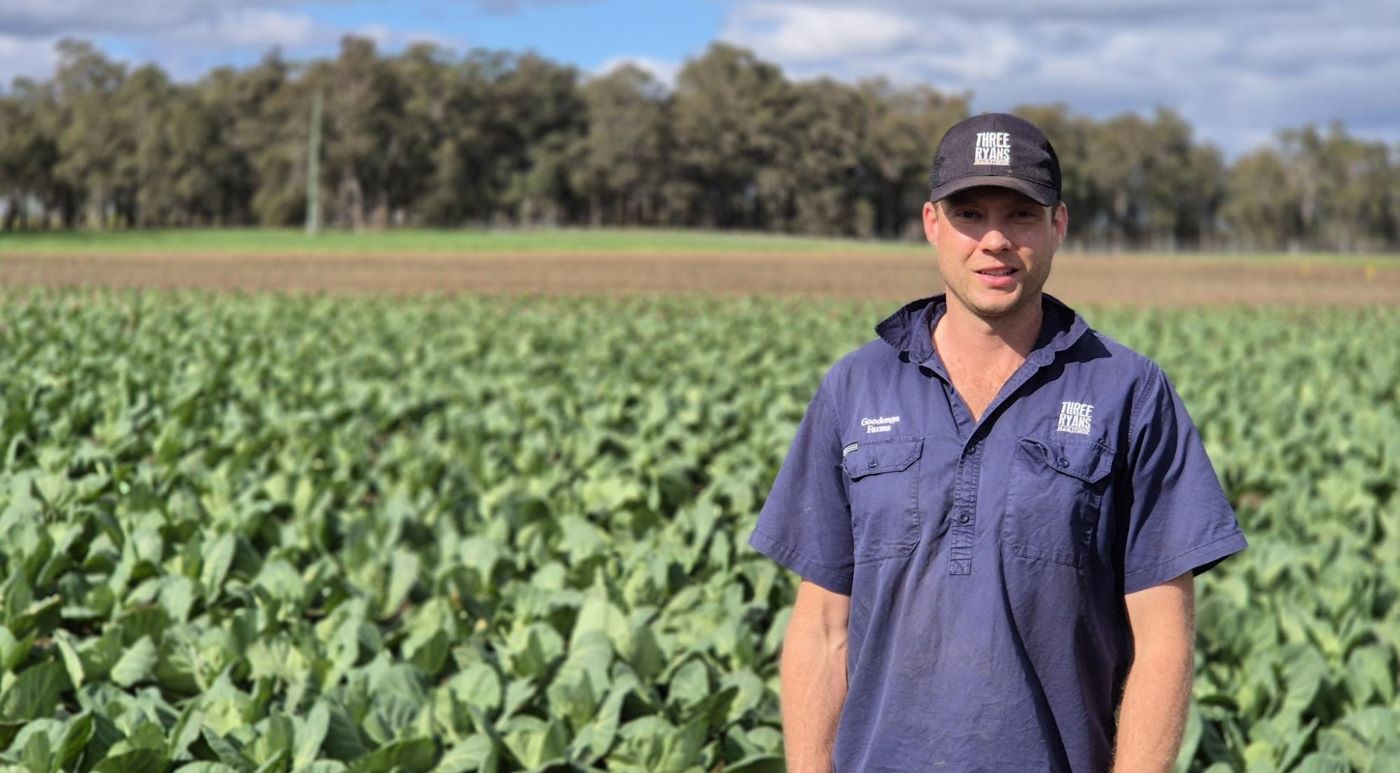
Jake Ryan is a fourth generation farmer on Three Ryans Farm in Manjimup, WA, which was purchased by his great grandfather. Jake became involved in the family farming business in partnership with his parents after he completed a degree in Agribusiness at Curtin University in 2017. The family was already implementing rotational grazing and crop rotations when Jake returned to the farm. Jake has carried on this momentum and they have continued adopting new practices. They implemented planned grazing in 2018 across the whole farm after observing a big difference in pasture growth and animal health from an initial small trial. Following this change, they have increased sheep numbers from 600 to 1,000 ewes with no extra land or fertiliser.
All the paddocks on the farm follow a rotation of one year in vegetables, one year in seed crop, then two to three years in 8–10 species mixed pasture used as a cover crop for soil building, before the paddock returns to the vegetable phase of the rotation. In 2018–19, they were the first farmers in WA to adopt strip tillage, tilling only a strip of soil where the seedlings are planted instead of continuing the previous practice of tilling the whole paddock. In one season of strip tilling 24 ha of vegetables, they were able to save $10,000 on diesel. Over the past five years, EBIT (earnings before interest and tax, and lease costs) has increased from 2 to 10%.
Jake now makes liquid fertilisers for foliar applications on vegetable crops and pastures. He uses soil and plant testing to guide these applications.
Location: Noongar Country, Manjimup, Western Australia
Regional Climate: Mediterranean climate, cold wet winters, hot dry summers
Average Annual Rainfall: 981 mm
Property Size: 200 ha, with an additional 36 ha leased
Elevation: 250 m
Social Structure: Family farm
Enterprise Type: 27–35 ha of brassica vegetables, 1,000 merino ewes for first cross lambs and wool, Angus cattle, cropping for pasture seed
Monitoring practices: Plant sap testing, Plant Brix testing, Soil laboratory testing
Soils: Loamy gravels with high organic matter; organic carbon ranges from 5 to 10%
☰ Jump to
How to start monitoring
Decide what you want to know
It is important to clarify what you want to learn from monitoring. This will help you to choose monitoring practices and monitoring sites that answer your questions and support the decisions you want to improve. Focusing on what is most relevant to you makes it easier to incorporate regular monitoring into your farm management program.
Being clear on why you are monitoring can motivate you to make monitoring a regular practice. Consider what soil health means for your farm and business. Monitoring is far more powerful when it aligns with your goals and vision for your farm by supporting what you are trying to achieve and answering questions that are relevant to your business.
There are a lot of options to choose from when monitoring soil, plant and landscape health. When deciding what to monitor, there are a few key questions to ask:
- What information would you use to make decisions?
- Do you want to track your progress towards your goals in improving soil, plant or landscape health?
- Do you want to investigate soil constraints or plant health issues?
- What is your budget for monitoring?
- How much time do you have available for monitoring?
🥾 Tips from farmers: Deciding what you want to know
Michael Baldry
Michael Baldry wanted to gather data to communicate the improvements in soil and landscape health he was observing from his practices. ‘We were getting anecdotal results that felt good, you could see the recoveries and the difference in the paddock, it seemed obvious it was working. Everyone wants objective measurements and peer reviewed data, so I thought, “Let’s start measuring.” The communicator in me wanted solid data, I knew without that I am not going to be able to influence anything,’ says Michael.
Michael is hoping that monitoring will help him communicate what he is seeing more clearly with others. He hopes collecting this data will help influence change to mainstream practices, and that over a long period of time it will leave behind a legacy that tells the story of the production and biodiversity that has occurred on his place.
He plans to continue to collect data for the long term over the next 10 to 20 years, to bring in other professionals and to have solid information which can be a reference point for practices and outcomes. Michael explains, ‘It’s a working farm but I also hope other people can come here to learn, improve and continue monitoring.’
Gillian Sanbrook
Gillian Sanbrook’s monitoring began through implementing the Holistic Management decision-making framework where the cycle is to plan, monitor and replan. Her original motivation was to improve management and support better decision making in a period of drought, debt and declining farm conditions. Emphasising the importance of understanding the purpose of monitoring, Gill says, ‘You have to ask, “Why am I doing it?” Monitoring needs to connect to a clear management purpose or it becomes difficult to maintain in the long term.’ Monitoring has also helped her build evidence of the observed ecological changes that have happened over time.
Gillian explains, ‘When I came to Bibbaringa, I thought, “Well I’ve got a clean slate, and I know how to monitor. With all the naysayers about regenerative farming, then I’ll have these records just so I can see what happens, and someday someone may want to use the data for research.”’
For Gillian, monitoring also provides a way to stay deeply connected to the landscape ‘because you’ve got to get out there on your knees, and you’ve got to smell the dirt, and you’ve got to go and dig with the dung beetles, you’ve just got to be in the landscape, you’re part of the landscape, part of country’. It’s this connection that gives her confidence in the decisions she makes on the land.
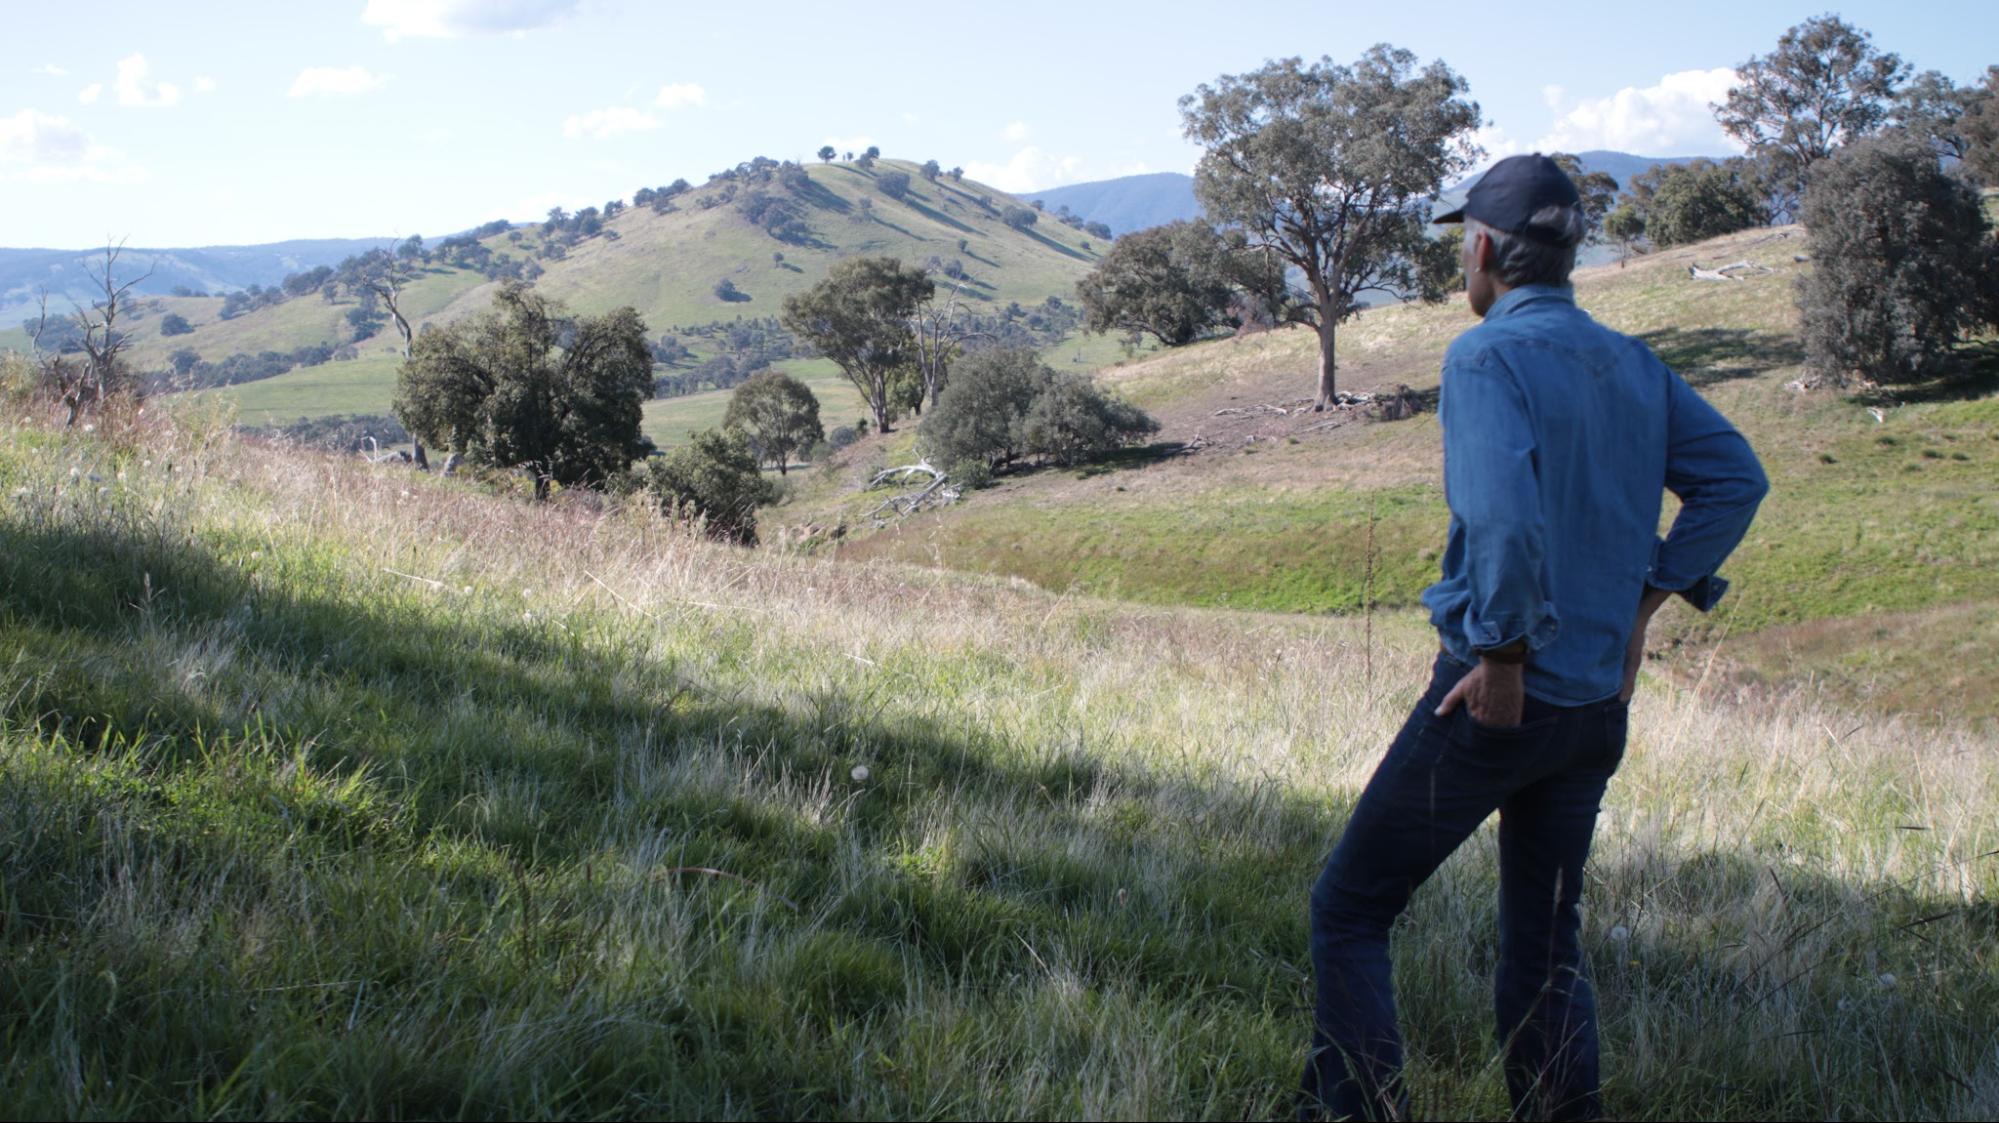
Image 4. Gillian Sanbrook observing the ecological changes in the landscape at Bibbaringa. Source: Grow Love Project.
Jake Ryan
Jake Ryan uses monitoring to inform management and agronomy decisions that support the goals of staying profitable, reducing input costs and improving efficiency. Monitoring has been used to guide the transition to incorporating mixed species cover crops, adopting planned grazing, and making their own foliar fertilisers.
Jake explains, ‘Buying liquid fertilisers means you are buying a lot of water, and we weren’t happy with the results based on the price we were paying. So it got me thinking, “Why don’t we just do it on farm, like how hard could it be?” Then over the last seven years now we’ve been perfecting recipes and we now make a lot of stuff on the farm.’
Jake uses soil tests to determine base saturation and adjust liming rates, and plant sap tests to guide foliar fertiliser applications. He measures Brix to test vegetable varieties and inform pasture foliar applications. ‘I’m not collecting data for collecting data, I am collecting data for my management decisions and particularly agronomy decisions,’ Jake says. ‘We are trying to grow the healthiest plants and the healthiest animals possible, and by doing that I think you get the benefit of the natural ecosystem benefiting from it. Just by applying the right nutrients at the right time means you’ve got less leaching and less washing away, ending up in your river, ocean and what not.’
Start simple
A few simple, hands-on methods and basic tools are all you need to get started. You don’t need to invest in expensive equipment. You can learn a lot about soil health by digging a cube of soil (20 cm x 20 cm x 20 cm) with a spade and looking at root depths, soil colour, soil structure and counting the number of earthworms. Plant and landscape observations are easy to capture by taking photographs of ground cover and photo points of the paddock while you are there.
Start by recording three to five observations from a point on your landscape that you can easily return to for repeat measurements. Avoid the temptation to set up a large number of monitoring sites while you are learning. Starting with a small number of sites that represent the main soil types on your farm makes it easier to continue monitoring and is less overwhelming than a large number of sites.
👉 Find out more: Commonly used resources
- Soil HASH 1 Manual: A practical guide and scorecard system designed for landholders to monitor, assess and manage soil health. Developed by Soil Land Food, Soil HASH stands for Holistic Assessment of Soil Health. You’ll see it referred to throughout this guide as HASH.
- Soils for Life Soil Health Assessment Guide and Record Sheet
Five quick and easy field methods to assess the health of your soil:- Photopoints
- Groundcover
- Water infiltration
- Aggregate stability
- Soil organisms
💡 Tips and tricks: Build your monitoring skills
Investing in learning and support can help you establish a monitoring program that fits your reason for monitoring and answer your questions. It can save time and help to ensure that the data you collect is robust. Here are some ways to support your learning and skill development:
- Choose one monitoring resource and work your way through the recommended steps.
- Attend workshops and field days.
- Ask an experienced farmer to support you.
Some people find working with a soil, plant and landscape health specialist can also help with data collation and management over time, in addition to helping to make sure monitoring happens. Learning to monitor soil, plant and landscape health is a skill that is developed through practice, and you get more confident the more you do it.
🥾 Tips from farmers: Getting started
Michael Baldry
Michael Baldry started soil monitoring after attending a soil health workshop with his farm employee, Geoff Bryant. Geoff has a degree in Agricultural Science and carries out the soil monitoring every year. Michael and Geoff use the HASH method1D Hardwick & R de Lastic, ‘Soil HASH 1 Manual’, Soil Land Food, 2025. developed by David Hardwick and his team at Soil Land Food for soil health monitoring, and have worked with David to help refine the HASH method and receive assistance with monitoring techniques and data analysis.
Gillian Sanbrook
Gillian Sanbrook started monitoring as part of her Holistic Management decision-making process. Gillian values having one-on-one mentoring and support from David Hardwick to incorporate the HASH method into her monitoring process. Gillian says, ‘David and his assistants came out and did the trial work and developed the HASH system, then they showed me what to do.’
Gillian is also part of a group called the 8 families. ‘We are the best group,’ says Gillian. ‘We meet regularly and we mentor each other constantly between meetings. I can’t tell you the power of that group and how that keeps you on track. We all talk about monitoring.’
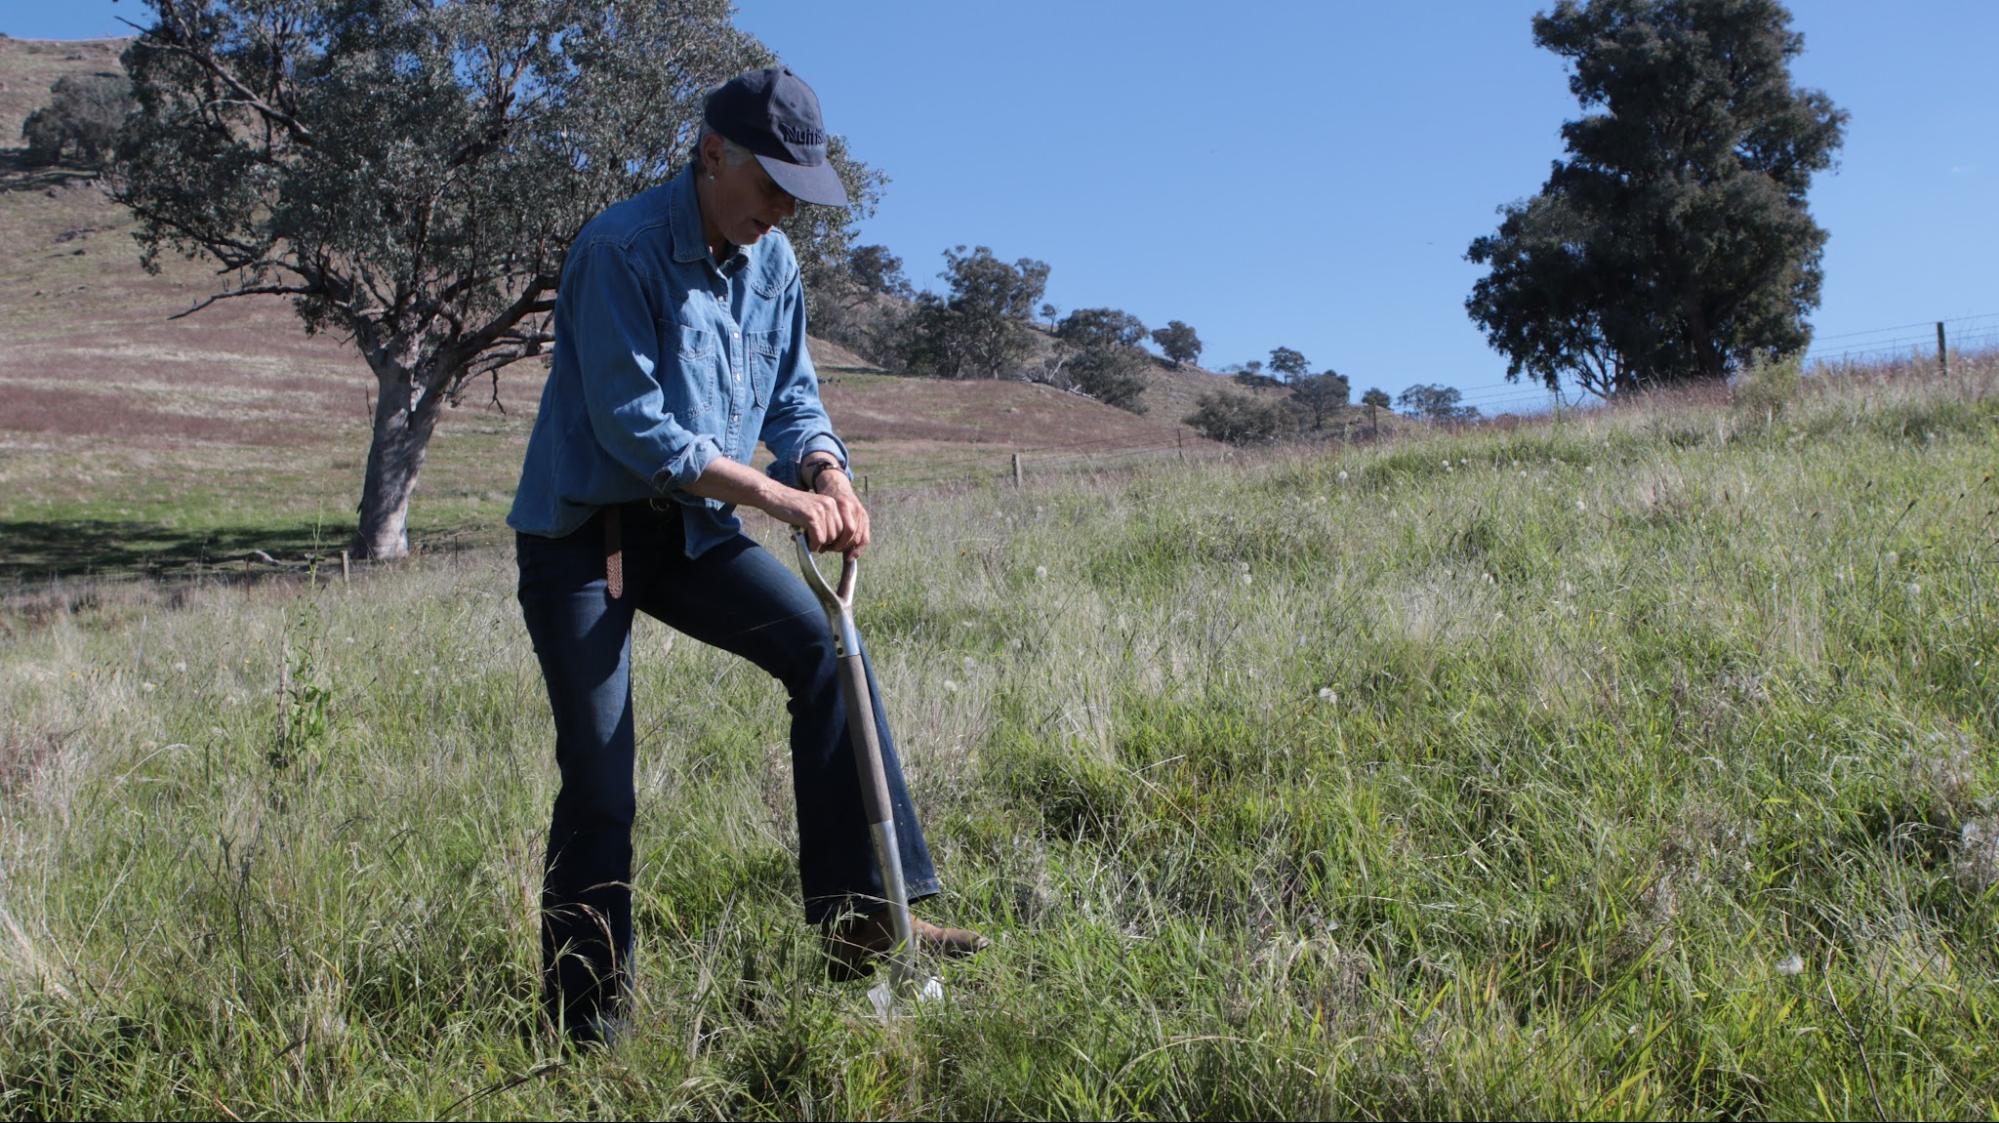
Image 5. Gillian Sanbrook digging a hole to monitor soil health at Bibbaringa. Source: Grow Love Project.
Jake Ryan
Jake Ryan did a lot of research using YouTube, podcasts, books and scientific papers to understand the whole system better. ‘I started watching Joel Salatin at uni and got down the rabbit hole of regen ag including Gary Zimmer, John Kempf, Gabe Brown, all those big names. As soon as I got back to the farm I was pretty keen on implementing some of the stuff I had been learning about,’ Jake recalls. ‘I think because we researched it so well, we had an idea about what to do, what not to do and it was a matter of fine-tuning it for our system. My parents have always been big on understanding it before we adopt it. By doing that you know what would go wrong or why this would work, so that’s helped mitigate against too many big mistakes.’
Jake has learned monitoring skills through doing. He adds, ‘I wouldn’t say there is plenty of information out there, they normally keep it pretty secret. But along the way, you do learn how to make things these days. AI is now a great tool, but a lot of the stuff we were doing was before AI.’
Deciding where to set up monitoring sites
Deciding where you will monitor depends on what you want to know. Setting up monitoring sites where you can return to observe trends over time also improves the quality of the monitoring data you collect. Starting with one to three monitoring sites makes it easier to find the time to return to monitor again in the future.
Some considerations when deciding where to monitor include:
- Soil types: Where possible, assess soil health from each of the main soil types on your farm. Soils can vary across the landscape, following the landforms and changing according to the top, middle and bottoms of slopes. Each monitoring site should have uniform slope, soil type, vegetation and land use. In hillier areas, monitoring across the slope, rather than up and down a slope, is advisable.
- Avoid areas that are not typical of the paddock: It is important to avoid areas such as stock camps, gateways, troughs, fence lines, fertiliser dump spots, headlands, rocky outcrops, shelter belts, tracks and gullies.2Local Land Services NSW, Soil testing and sampling, accessed 23 September 2026.
- Consider comparison areas: You may wish to set up a monitoring site on a paddock that is performing well to use as a comparison to other paddocks that are not performing well that you are targeting for improvement.3D Hardwick & R de Lastic, ‘Soil HASH 1 Manual’, Soil Land Food, 2025.4Dr A Schapel and Dr M Retallack, Best Practice Management Guide: on soil health in Australian Vineyards Part A: Chemical and Physical. Ecovineyards, 2024. Or you may wish to compare different management practices. It is important that comparison sites have similar soil texture, colour and depth characteristics.
Record the location of monitoring sites to allow you to easily find them again. You can use a written map or GPS coordinates. Take care if you set up a physical marker that locates your monitoring site in the paddock to ensure it does not pose a risk in terms of livestock or human injury or machinery damage. Livestock can be inclined to rub on posts, which can attract them to the monitoring site and change the conditions as a result.
🥾 Tips from farmers: Setting up monitoring sites
Michael Baldry
Michael Baldry’s farm employee, Geoff, does the soil monitoring every year. Geoff has set up GPS points to locate their 30 monitoring sites in each of their 30 paddocks. They monitored all sites using soil laboratory tests in 2019 and 2020 and started using David Hardwick’s Rapid Assessment of Soil Health (RASH) method5The Rapid Assessment of Soil Health method was developed by David Hardwick of Soil Land Food. It has since been updated in the form of the Soil HASH method. (the predecessor of HASH) to assess soil physical health on all sites in 2020 and 2021. ‘This was a pretty big deal. In the last three years we have cut it back to just 10 sites, rotating these sites every year, so we still have 30 sites all up, and we do 10 each year so that each site is monitored every three years,’ explains Geoff. Geoff has chosen monitoring sites that are representative of each paddock and located mid-slope.
Gillian Sanbrook
Gillian Sanbrook set up five monitoring sites when she came to Bibbaringa, choosing locations that represented different aspects and terrain. Over time Gillian reduced these to three monitoring sites to reduce duplication. The three sites give her a good overview of different parts of the terrain. One site is at higher altitude (400 m), one is on a low-lying improved grass paddock and the last is in a rocky area with improved and native grasses.
How to collect quality monitoring information
Regardless of what type of monitoring is done, the real key to making monitoring worthwhile is consistency and taking note of the context in which any measurements are taken. For example, soil health properties are impacted by changes in soil moisture, which can be hard to predict. To get good quality data:
- Monitor at similar times of the year. Choose a time of year where you usually have good soil moisture and actively growing plants. If you can, monitor when the soil is moist but not saturated; one week after 10–20 mm of rain is ideal.
- Make sure each monitoring site has a consistent soil type and uniform slope. Sites should be at least 20 m away from fence lines, tracks, stock camps and the edges of areas.
- Use a consistent monitoring methodology. Consider the choice of protocol, laboratory and type of lab test to ensure your data is reliable.
- Record the conditions when monitoring. Note recent rainfall, crop stage, management history and soil type to help you to interpret the results and compare across years. Take care not to take soil or plant samples immediately after the addition of fertiliser or soil amendments.
- Take more measurements at each site to provide more accuracy. As a general rule of thumb, aim for three to five replications of each measurement at a monitoring site.
🥾 Tips from farmers: How to collect quality monitoring information
Michael Baldry
At Michael Baldry’s, Geoff locates the central point of a monitoring site using a GPS. The monitoring site extends 5 m to the north, south, east and west of the central monitoring point. Geoff works through the list of measurements on his field recording sheet, using the HASH protocol to record water infiltration, topsoil depth, soil colour, soil temperature, air temperature, vegetation, diversity of visible organisms and an earthworm count. Geoff also takes measurements of soil compaction using a penetrometer and collects samples of soil to send to EAL laboratories for soil chemistry analysis and Metagen laboratories for soil biology DNA testing. Some soil is also collected to take back to the shed to measure aggregate stability and bulk density.
Working with a soil specialist and having an employee with agricultural science skills has helped Michael set up monitoring practices that provide quality data and consistency. Geoff explains that ‘going to the same GPS point and using a methodology for collection of data makes the process robust scientifically’. Geoff emphasises the importance of consistent timing each year, using repeatable methods, choosing representative monitoring sites and being aware of how seasonal conditions and soil moisture impact some of the results.
Gillian Sanbrook
Gillian Sanbrook has established a monitoring practice informed by training and by working with soil scientists, mentors and peer groups. Gillian uses methods that are repeatable and simple, and these are consistently carried out at the same monitoring sites at the same time each year. ‘Bring in the experts, keep yourself up-to-date and find a good soil scientist or soil specialist who knows about living soil, that you can talk to,’ suggests Gillian. ‘The parameters keep changing so keep changing with them.’
Jake Ryan
Jake Ryan outsources the sampling to an agronomist to ensure that quality data is collected from lab testing. Jake also collects sap test samples on both old and new leaves and performs Brix tests at each site. He acknowledges Brix can be influenced by weather conditions, so he values it as an immediate indicator that supports real-time decision-making alongside the more detailed sap analysis.
Set up your data collection system
Before you start monitoring, decide how you will collect data consistently at each site over time. By keeping a record of your results, lab reports, notes and photos in one place, you will build a powerful history of how your soils and landscape respond to management.
It is important to have a method to record:
- Paddock name and site location
- Date and time
- Current land use and weather conditions
- Results from the tests
- Photographs.
There are a number of ways you can approach this. Record keeping tools farmers use to keep track of monitoring data include:
- Handwritten recording sheets collated in a file
- Digitally collating and saving photos in a folder with the date and location taken
- Excel spreadsheets for collating data over time
- Investing in apps that will track monitoring data for you.
Deciding on one method that best fits your needs and keeping it consistent over time is important to help gather quality data. Many farmers find that establishing a workflow in the field helps make monitoring data collection efficient and methodical. Recording sheets can be set up to follow the logical flow of data collection and can support this process to ensure you don’t miss anything.
👉 Find out more: Data collection resources
- Soils for Life Soil Health recording sheet: includes a table for recording your monitoring results
- Soil HASH 1 Manual: includes tips on recording data and workflow
- Northern Rivers soil health card: includes a results recording sheet
🥾 Tips from farmers: Data collection
Michael Baldry
When monitoring at Michael Baldry’s property, Geoff uses a field recording sheet that also acts as a checklist as he works through the monitoring process. He stores monitoring data and photos in apps on his phone. The field recording sheet is set up to make it easy to enter into the online recording system that is provided by David Hardwick. Michael is looking forward to having data more accessible in an app because it ‘is important to get it in a form that makes decision-making easier’. Michael uses AgriWebb6AgriWebb is livestock management software. to record grazing across his paddocks and is looking at how he can match up soil data with grazing management data over the period of the testing.
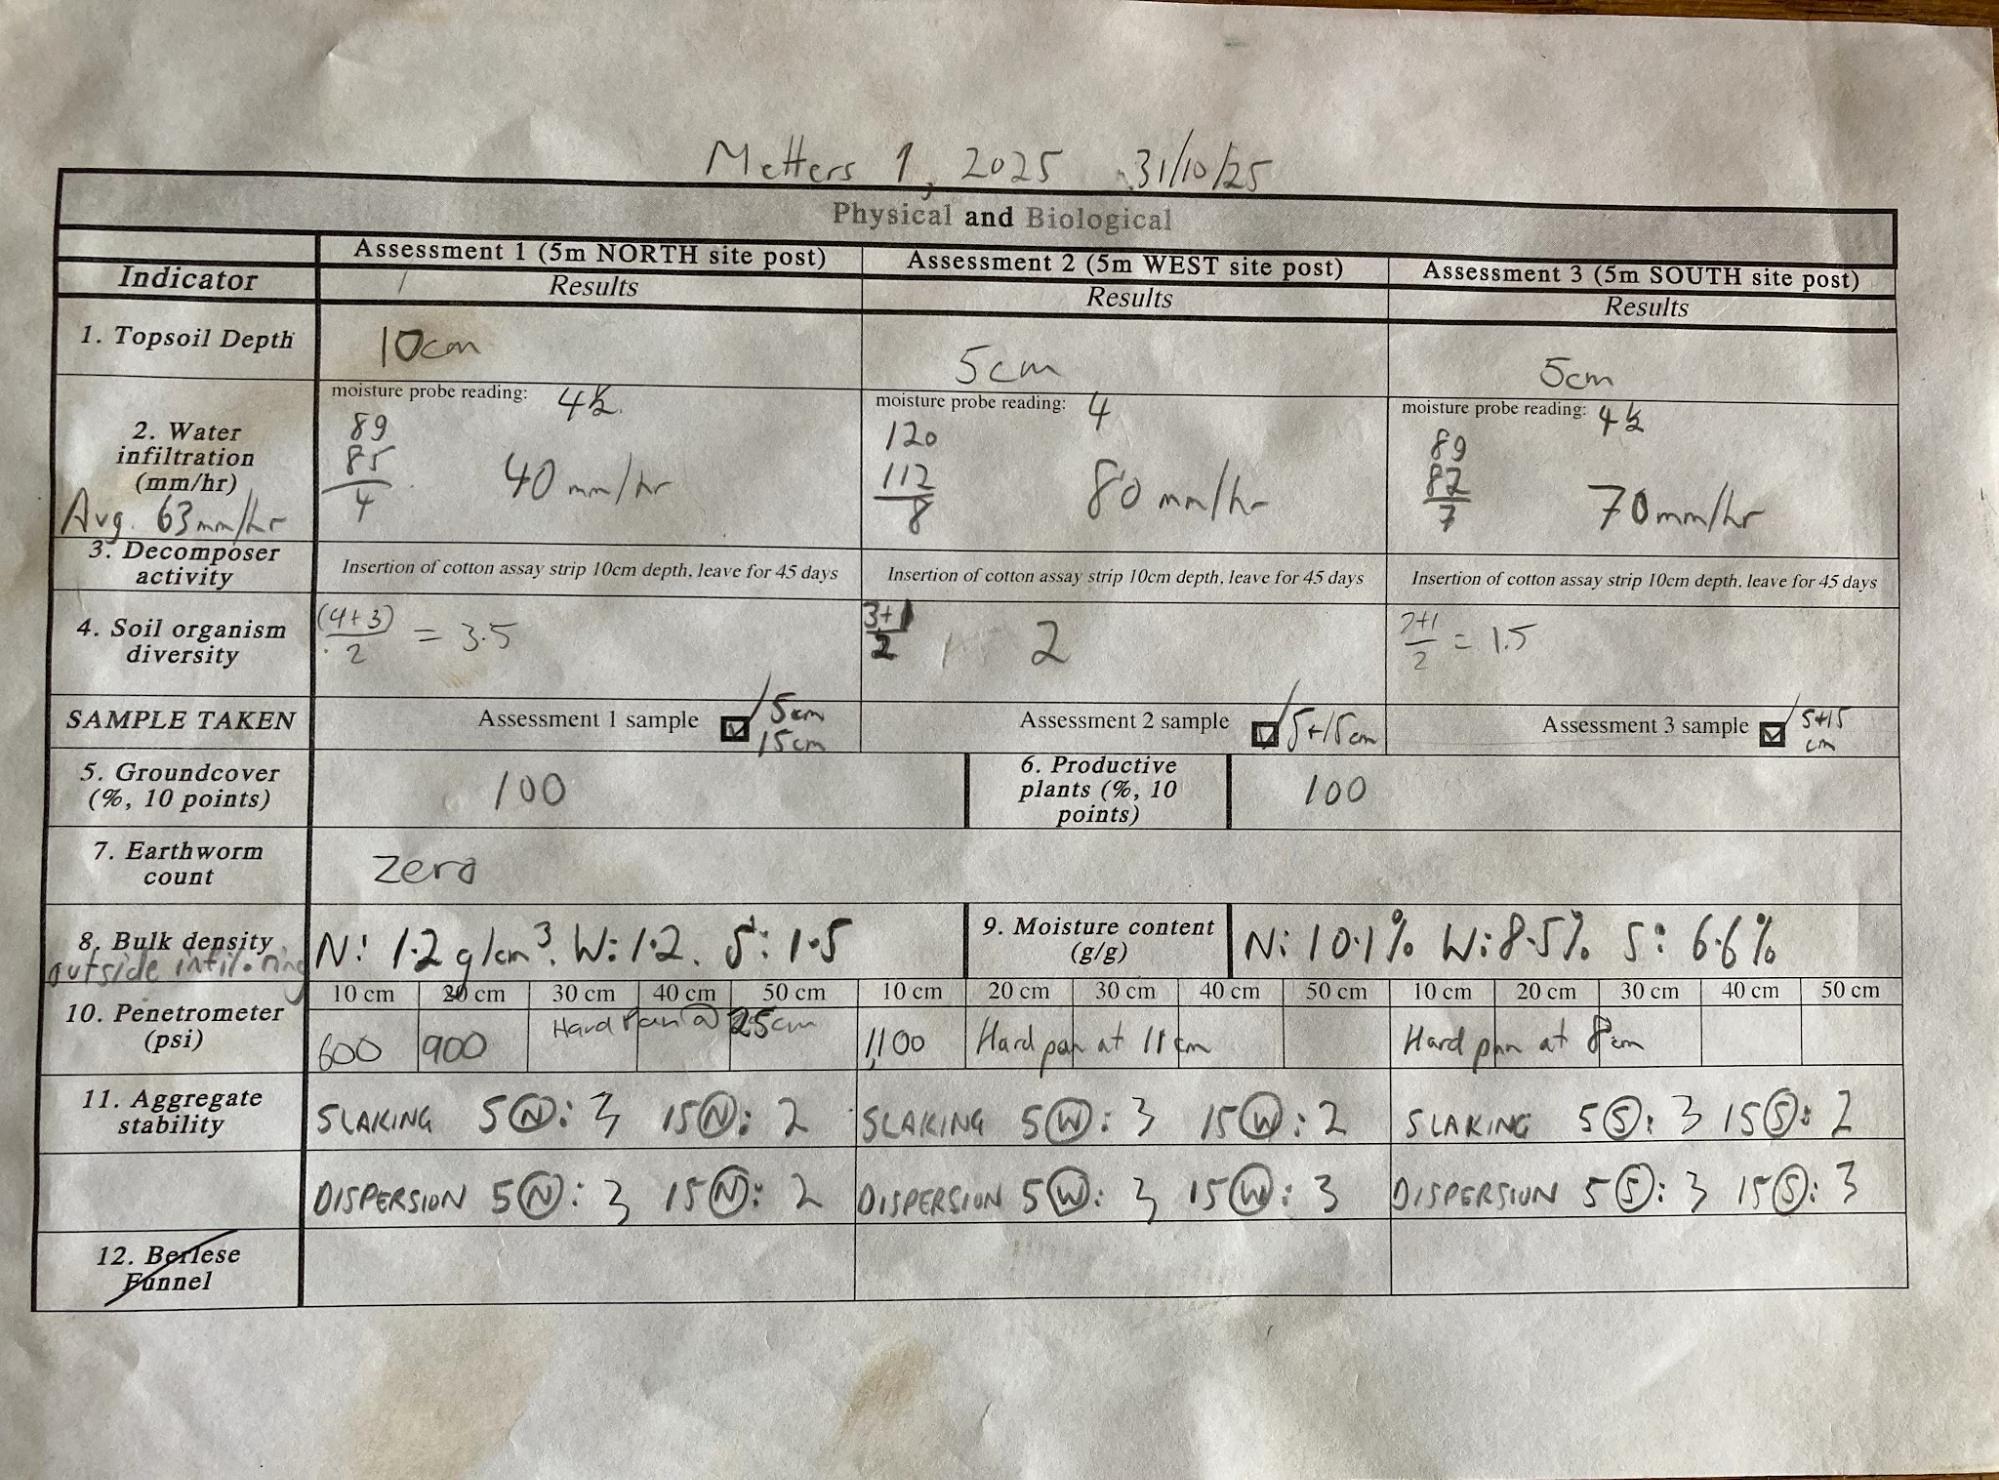
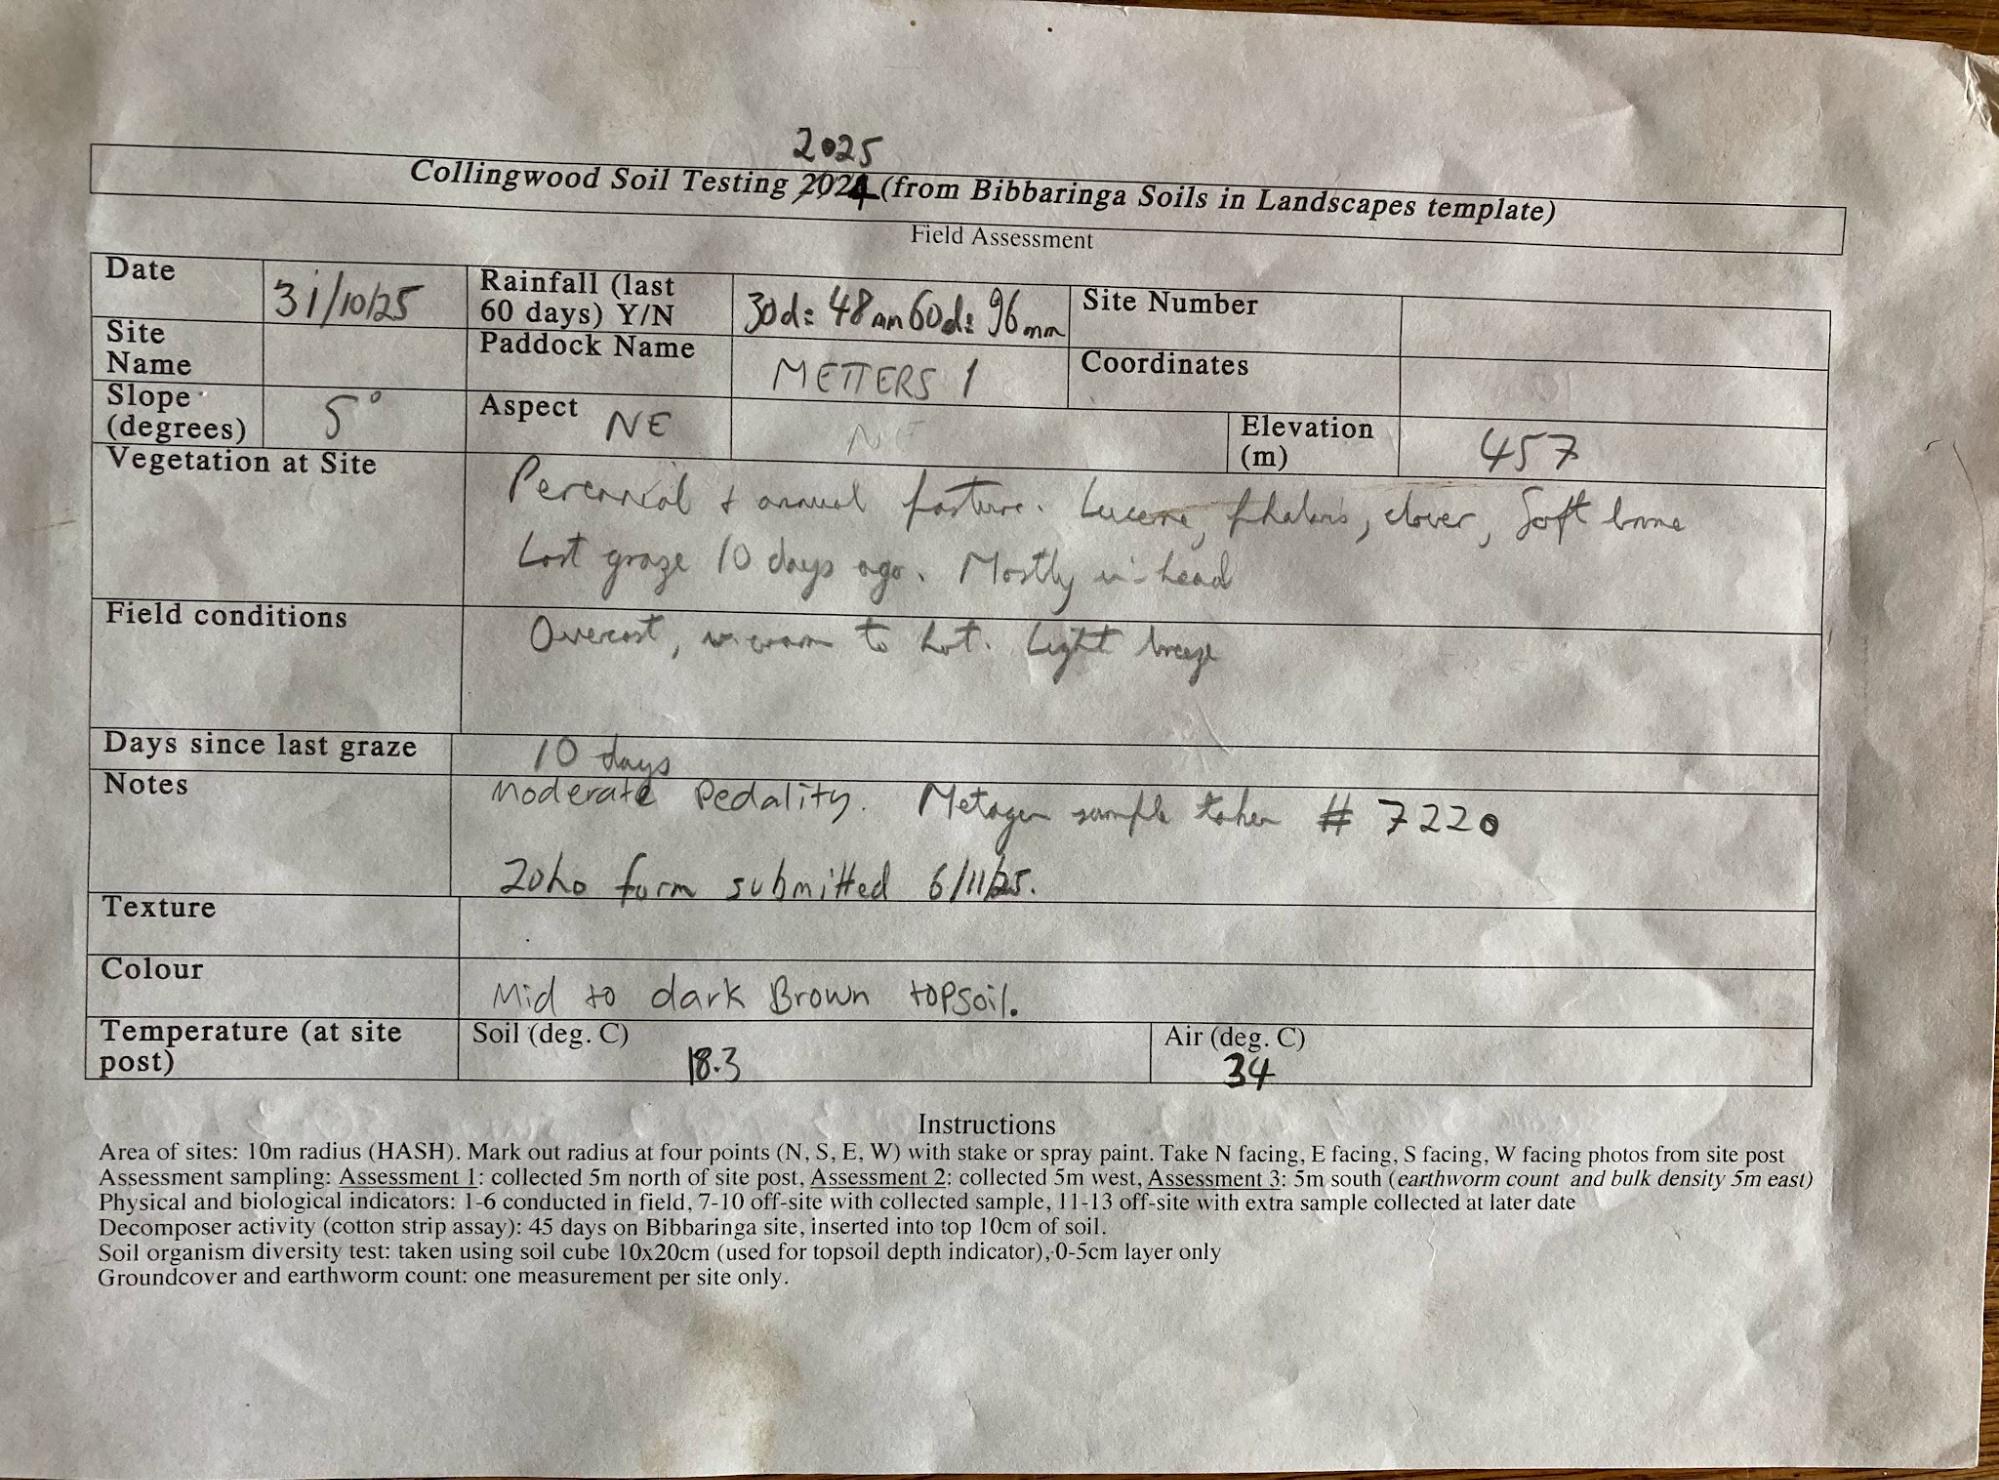
Images 6 & 7. Field recording sheets used for monitoring at Michael Baldry’s. Source: Michael Baldry.
Gillian Sanbrook
Gillian Sanbrook maintains long-term records of monitoring on Bibbaringa. These include maps, soil tests, photographs, grazing charts, biodiversity observations, natural capital accounting reports and bird monitoring records. HASH soil monitoring records are entered into an app and records are printed out. ‘I love sharing these reports when we have workshops on the property,’ says Gillian.
Atlas Grazing7Atlas Grazing is livestock and grazing management software. is another tool Gillian uses to record feed budgeting data and support grazing decision making.
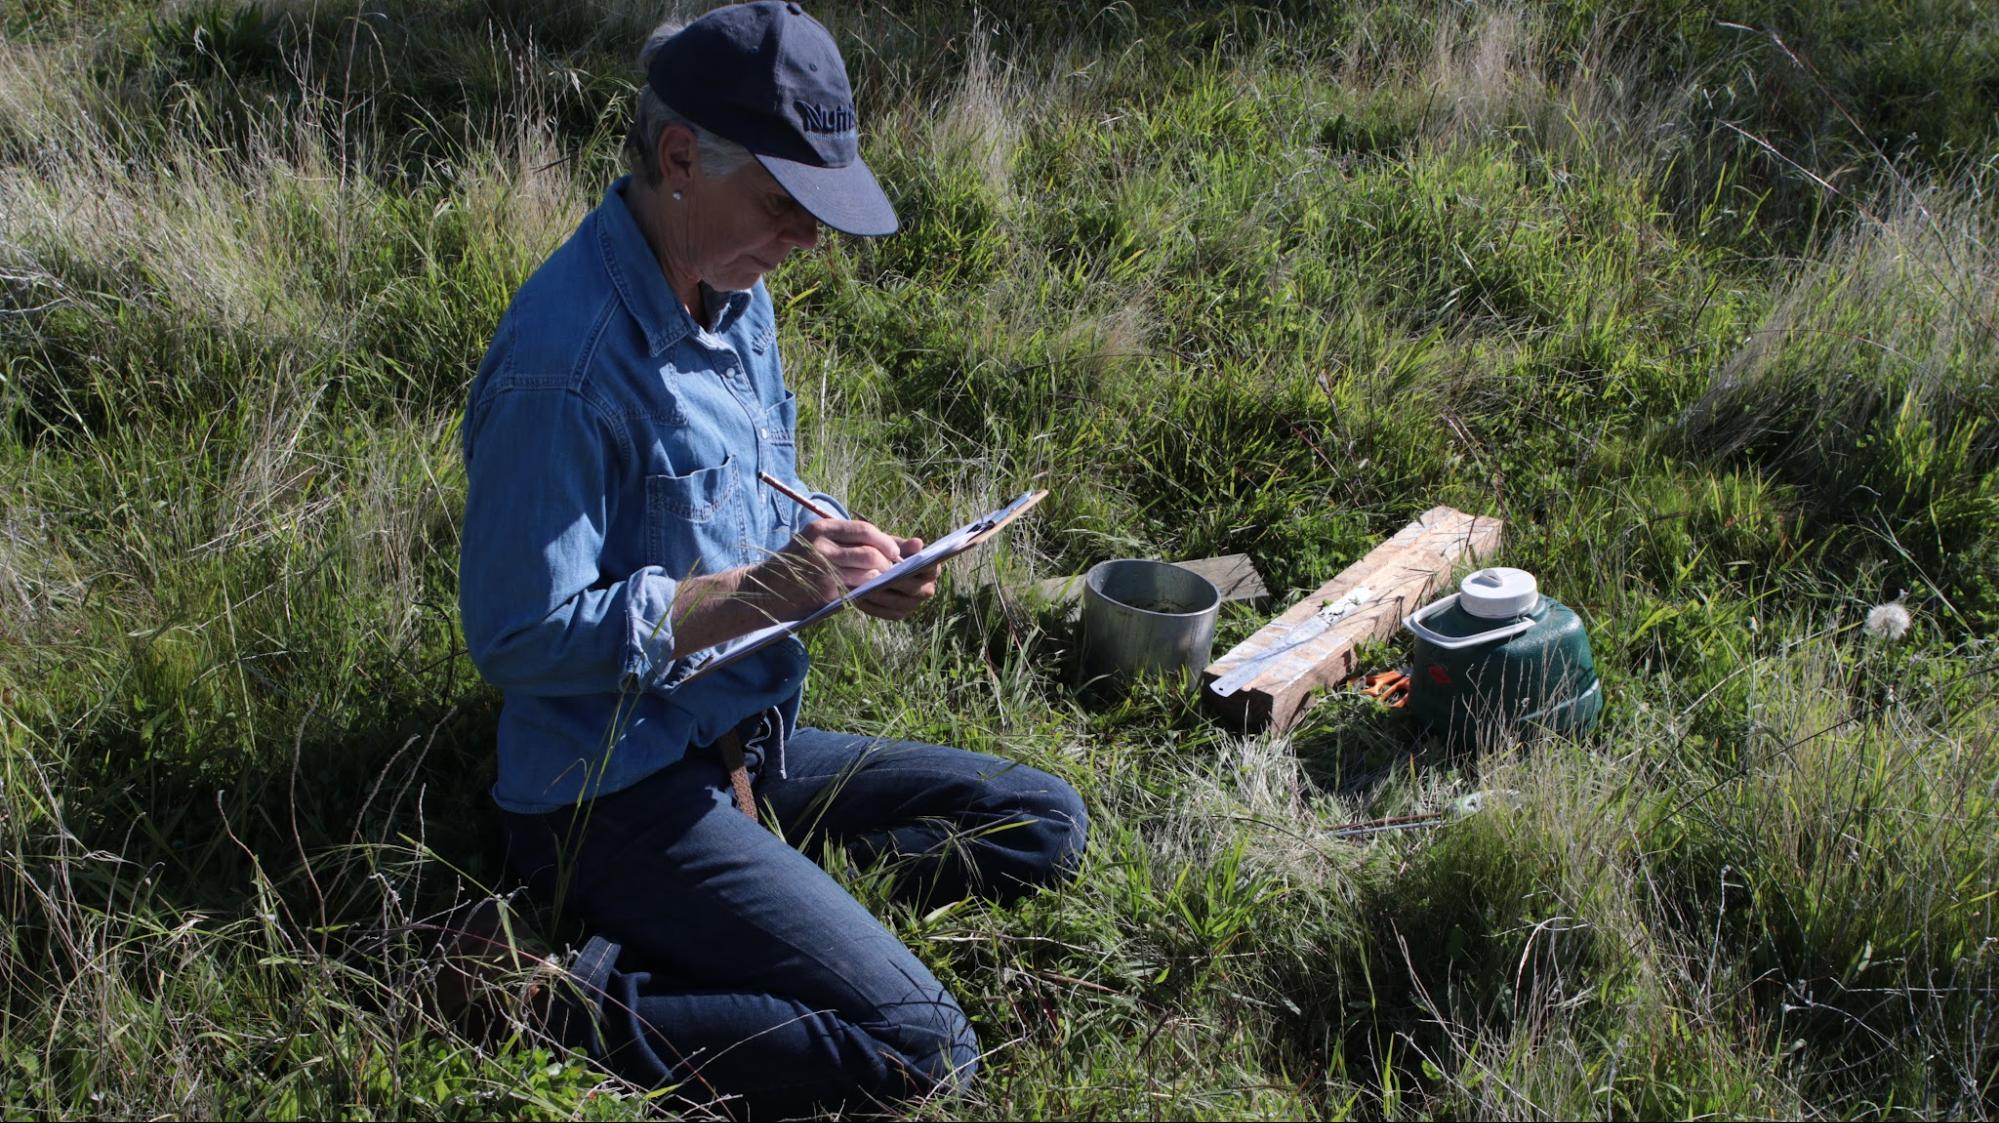
Image 8. Gillian Sanbrook recording monitoring data in the field. Source: Grow Love Project.
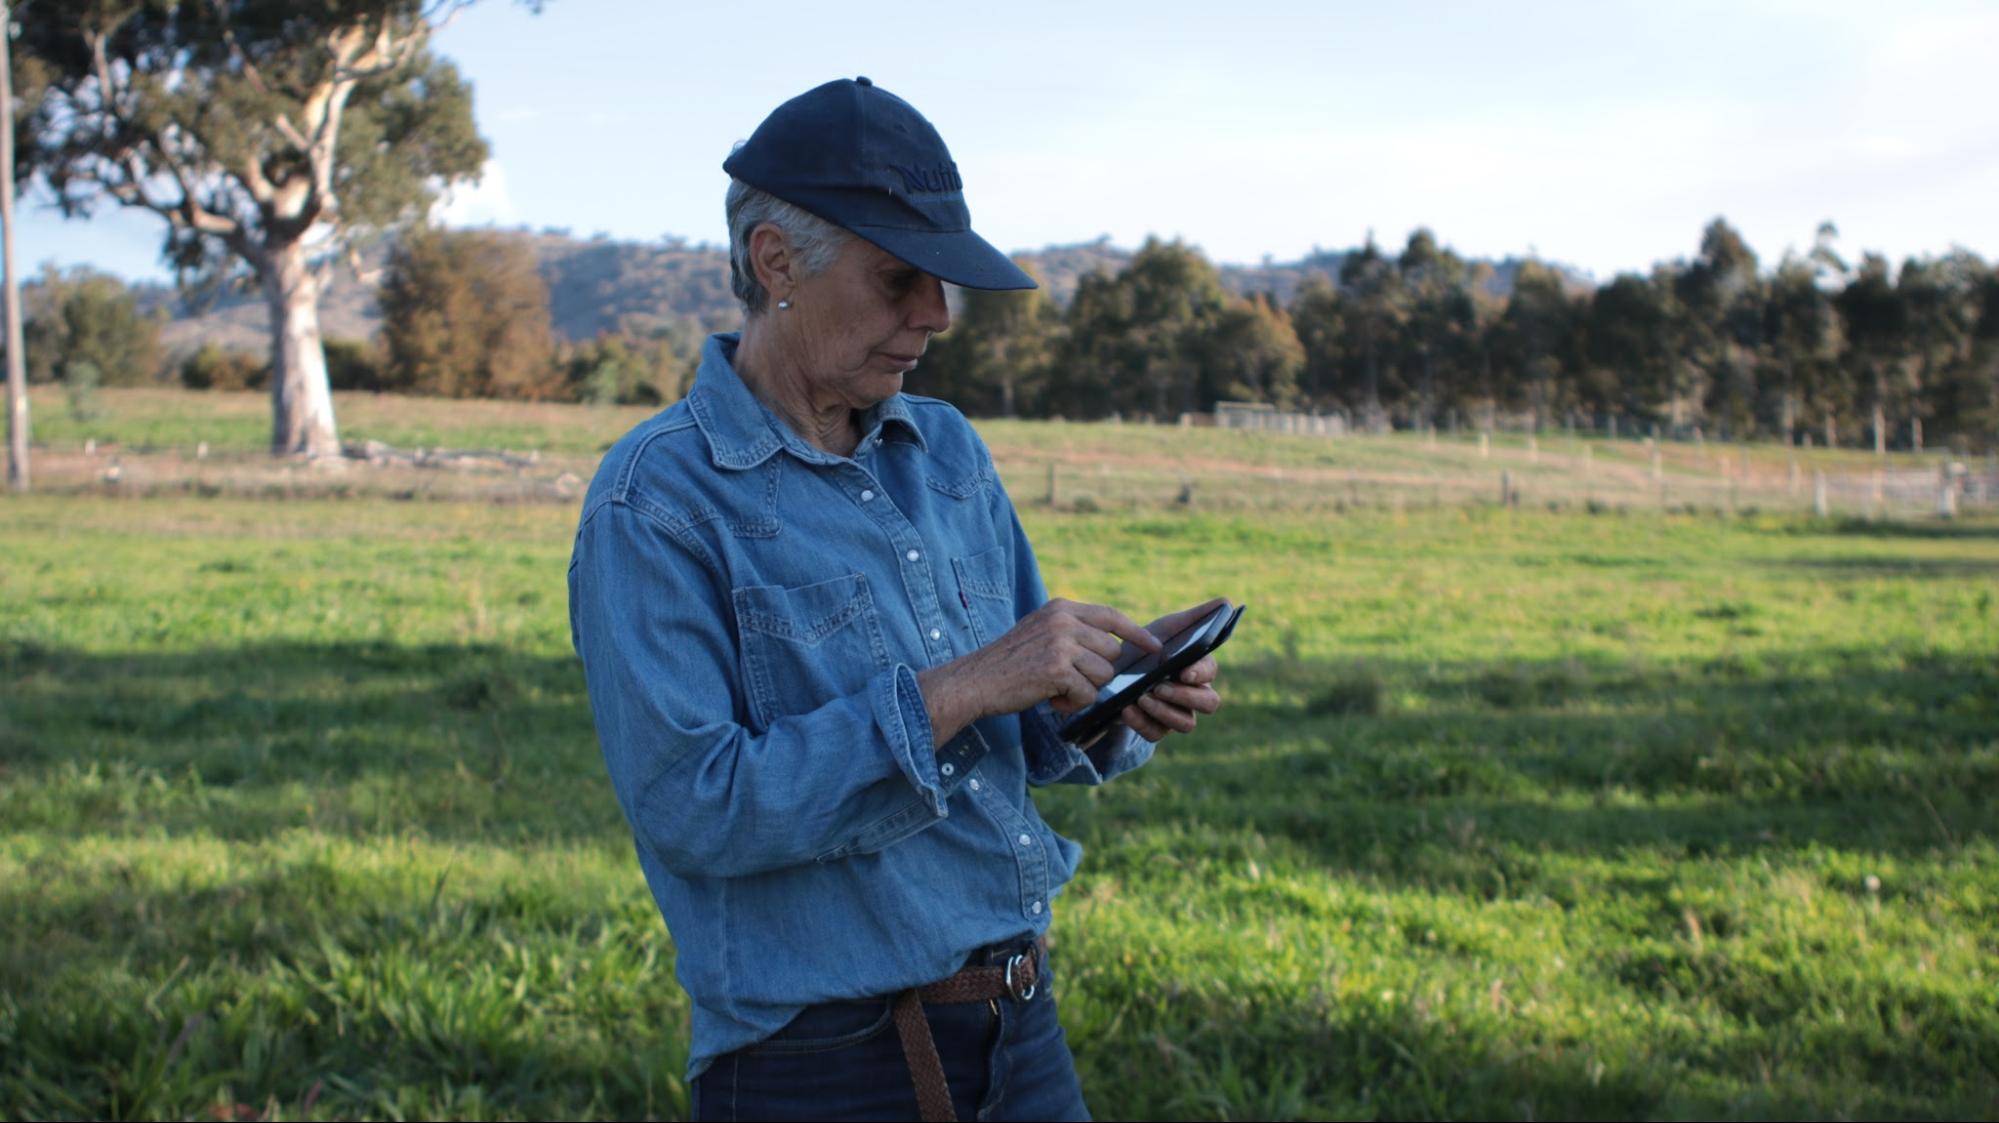
Image 9. Gillian Sanbrook collecting feed budgeting data in the field using Atlas Grazing. Source: Grow Love Project.
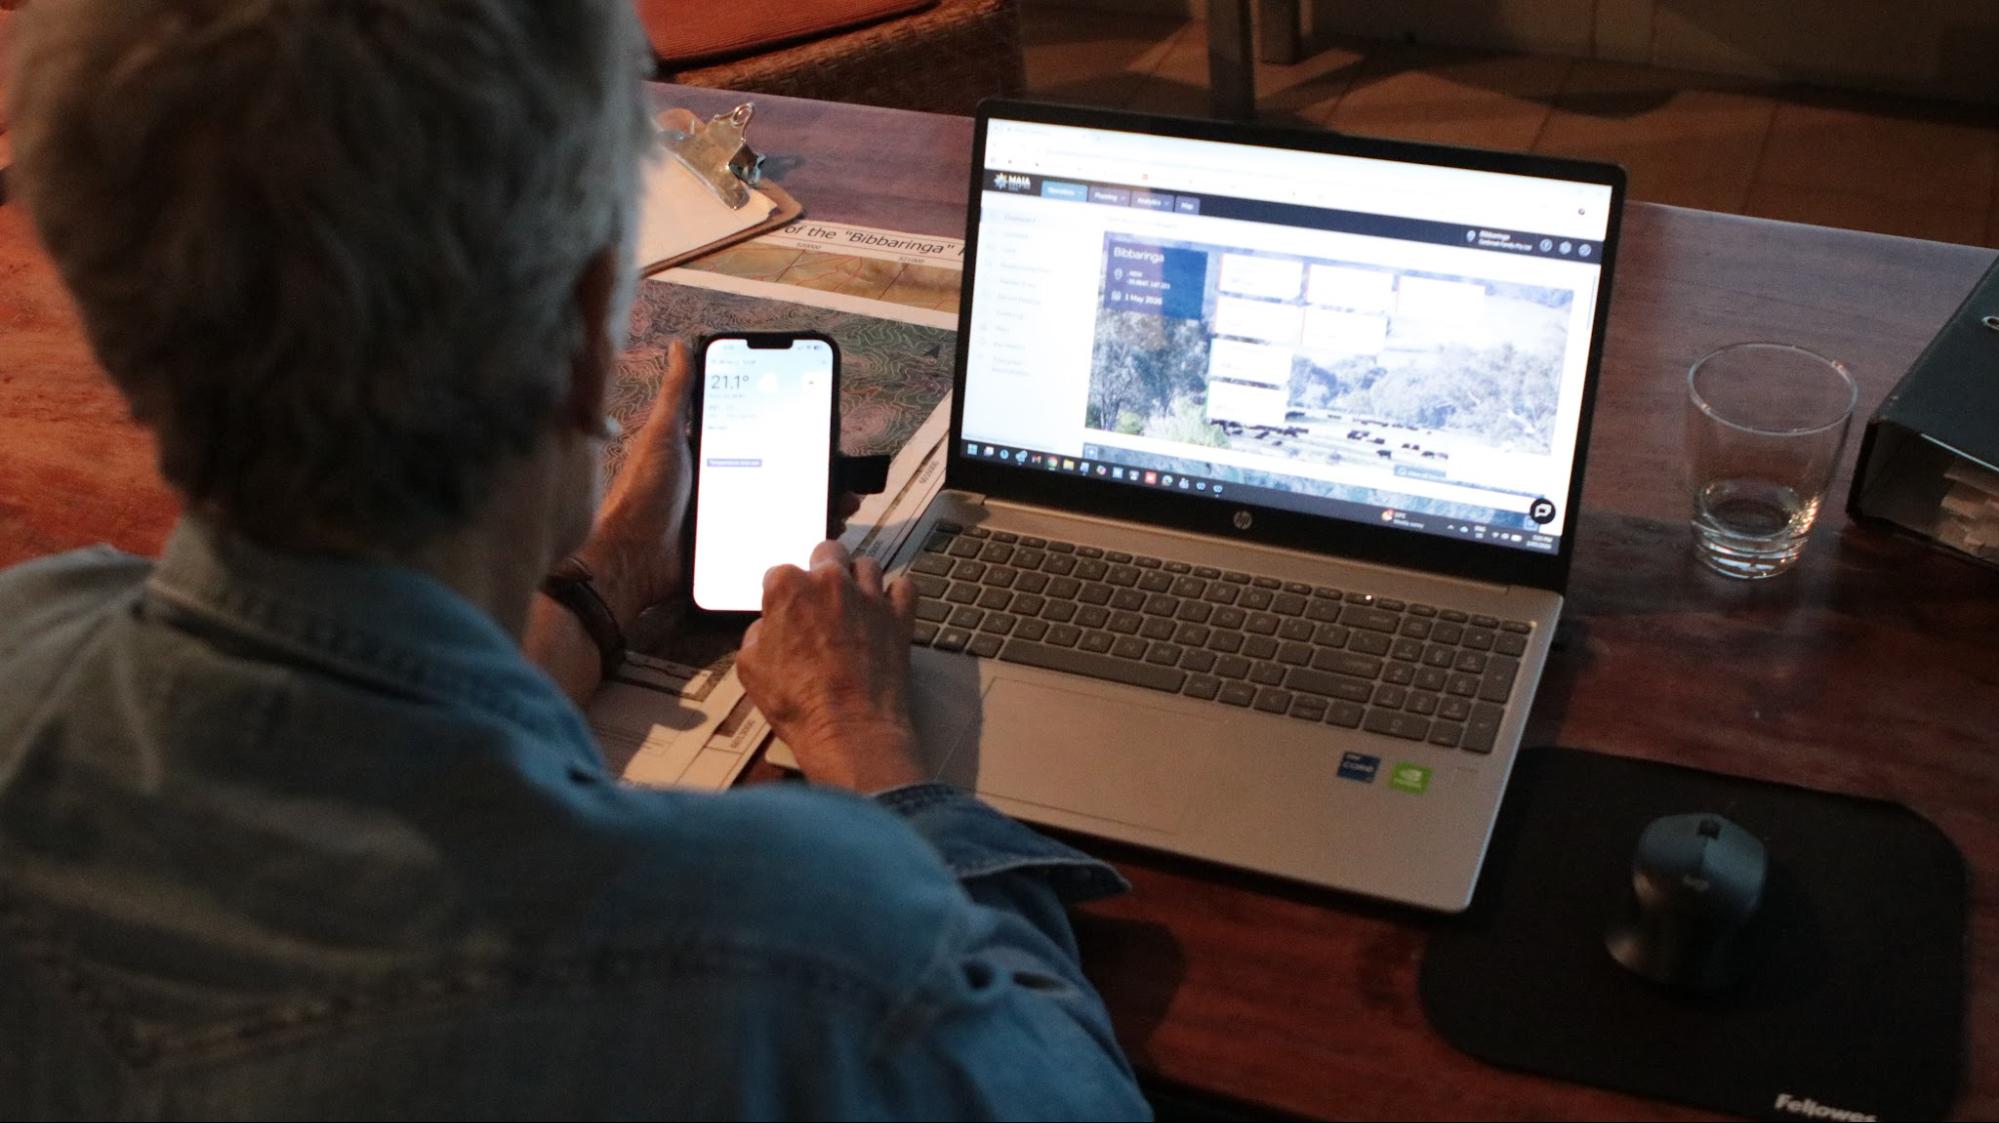
Image 10. Gillian Sanbrook collating monitoring data on the computer. Source: Grow Love Project.
Jake Ryan
Jake Ryan records sap test results and tracks the trends on a graph over the 12 weeks of the crop. These monitoring records are used to refine fertiliser applications.
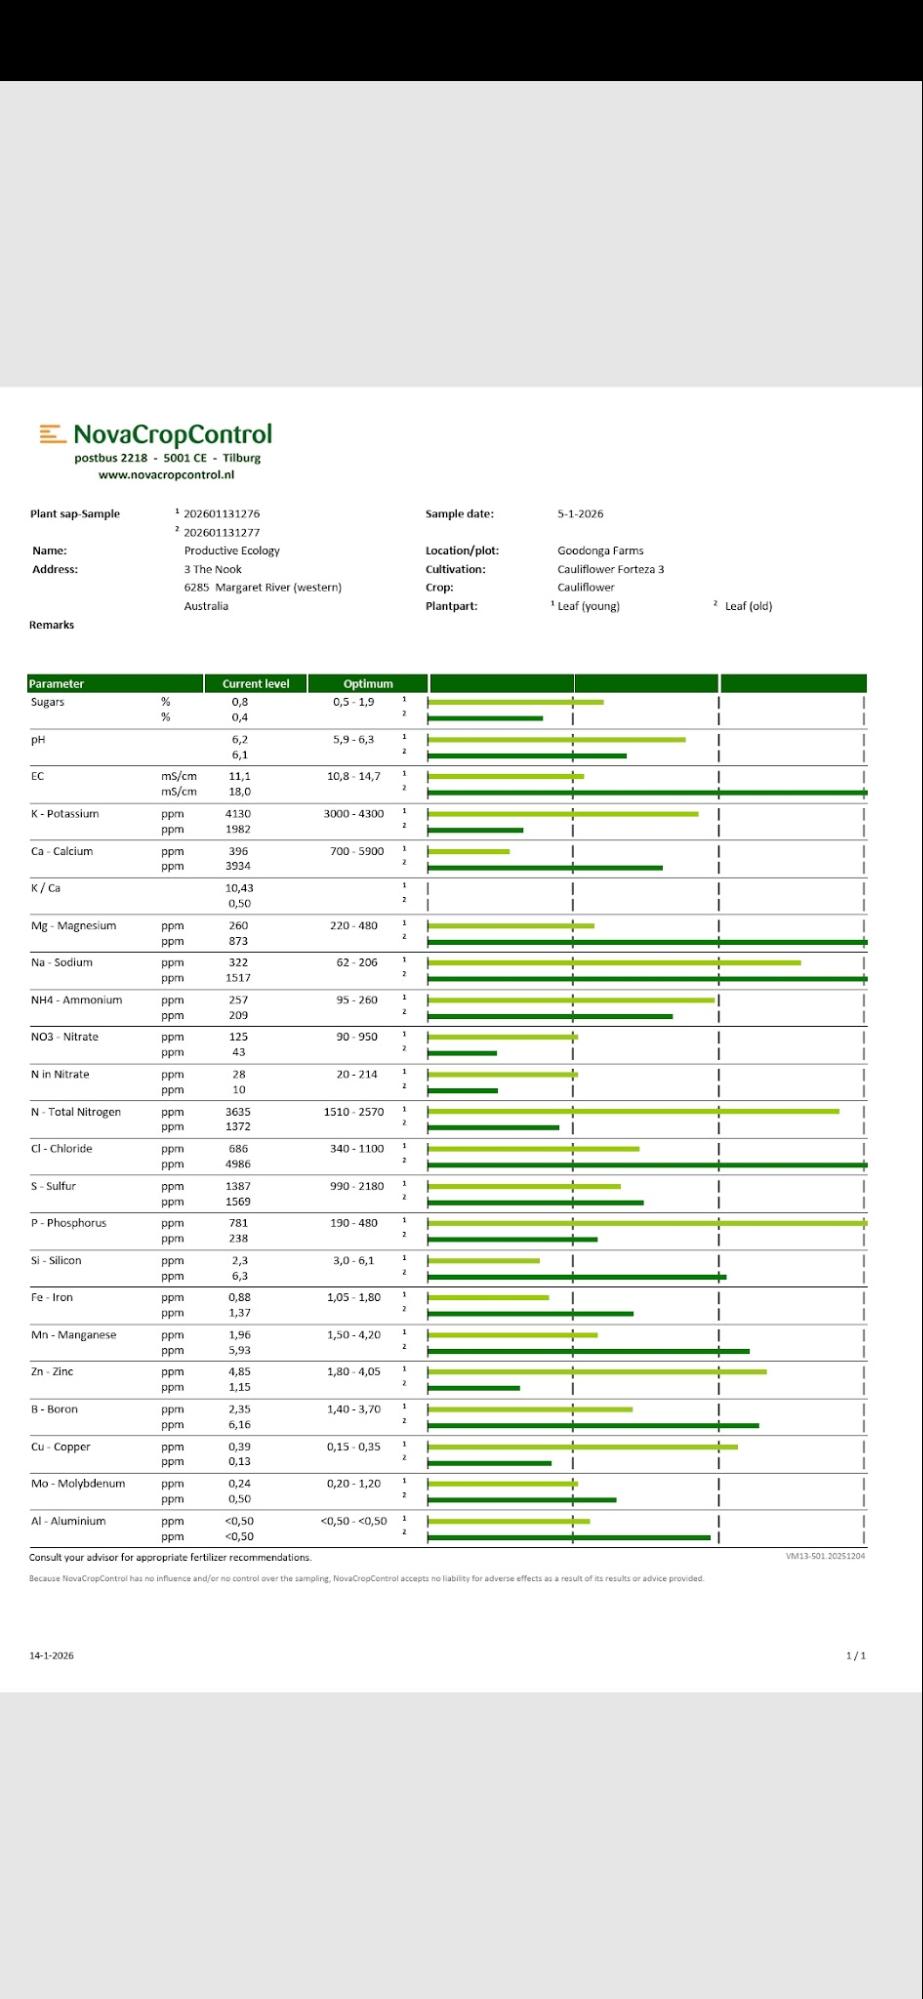
Image 11. Jake Ryan’s sap test results on a cauliflower crop, which he uses to track trends over the season. Source: Jake Ryan.
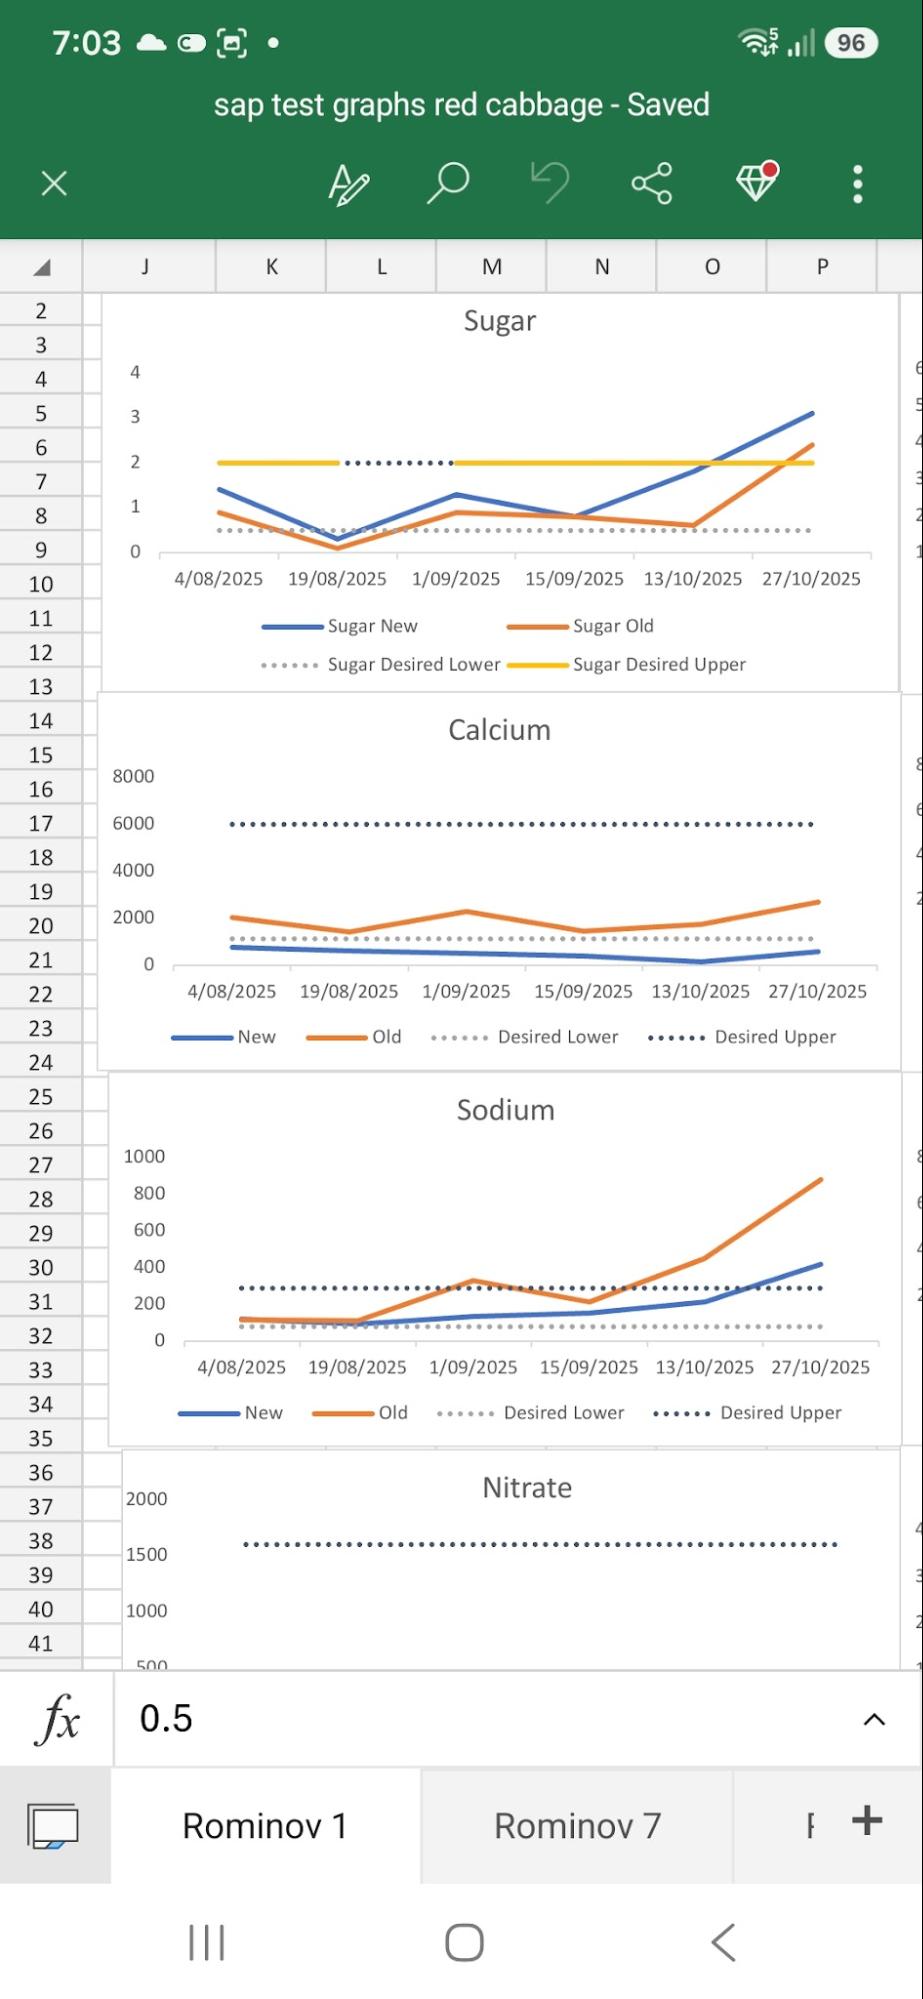
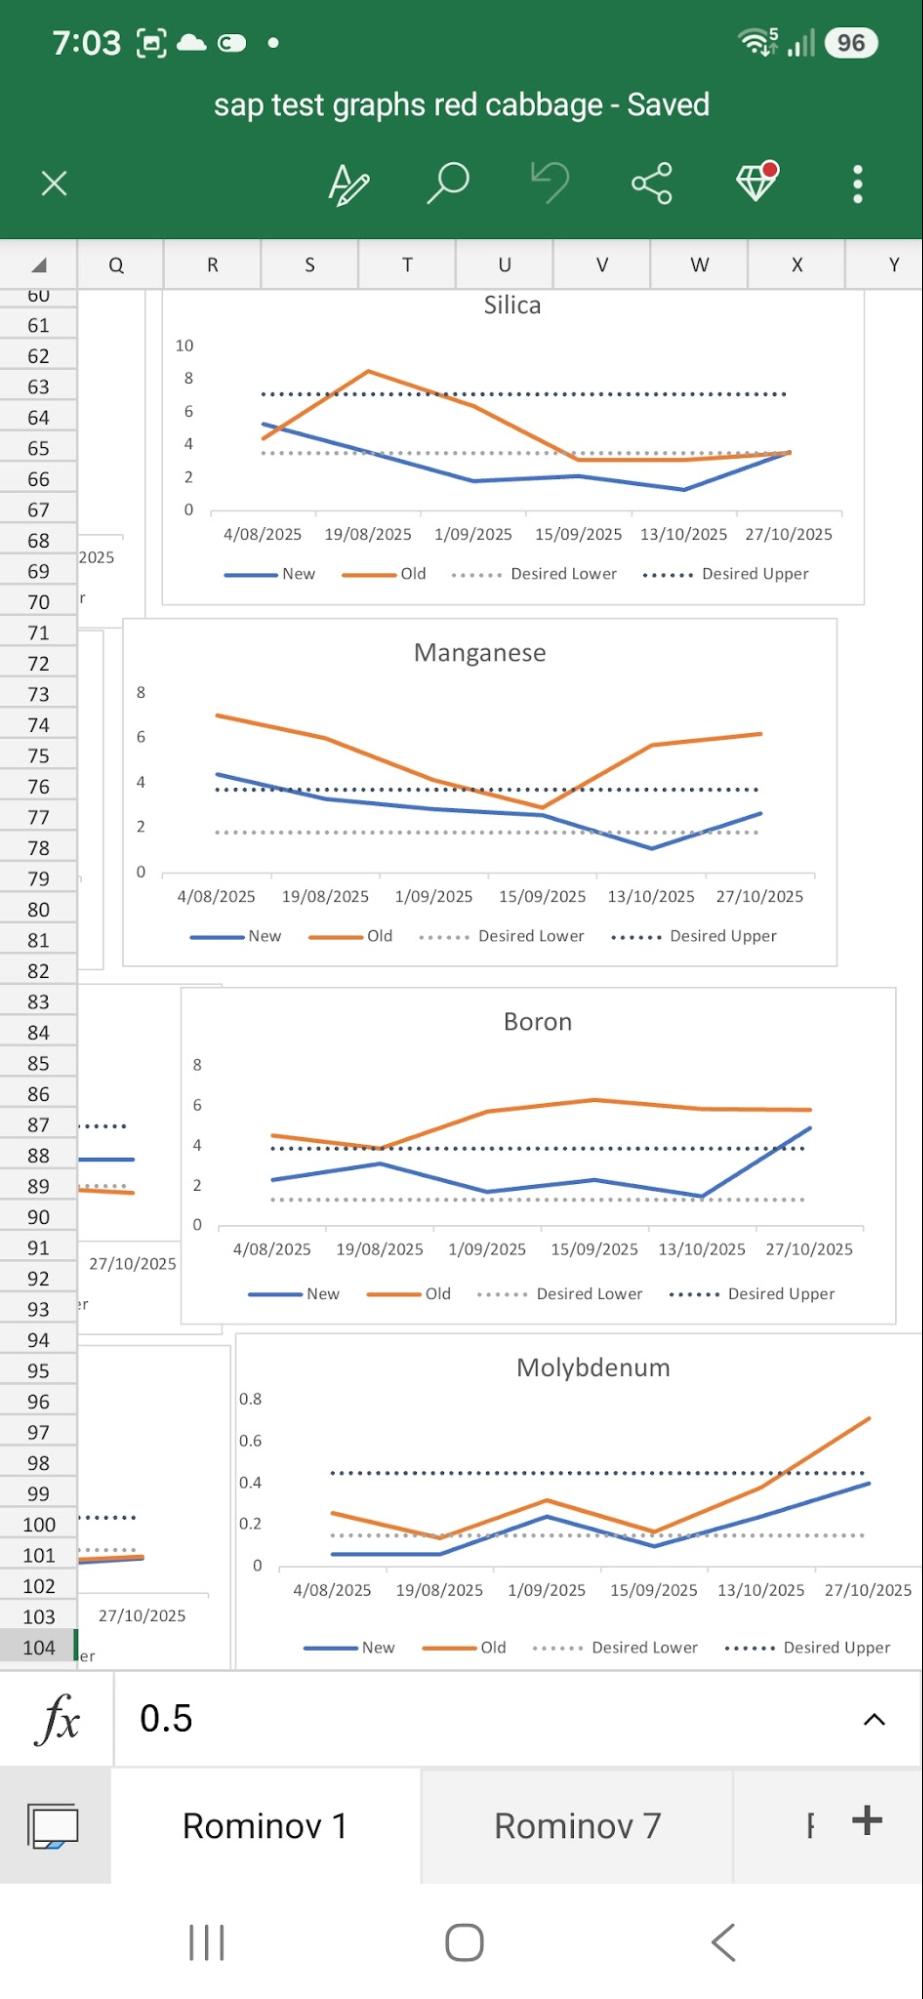
Figures 1 & 2. Jake Ryan records red cabbage sap test results on graphs to track the trends over the growing season. Source: Jake Ryan.
Allocate a budget for monitoring
Soil, plant and landscape monitoring options come in all shapes and sizes. Some methods, like photo points, visual soil and crop inspections and recording biodiversity such as birds, can cost nothing to get started. Spending a few hundred dollars will enable you to invest in monitoring equipment like a refractometer or penetrometer. Sending samples off to labs for analysis and/or paying for professional support can mean investing more.
The real return on investment comes from monitoring regularly over time. Monitoring becomes more valuable the more that you do it, as you get to see the trends over time. It also has the potential to pay for itself and even help you save money, since tracking soil, plant and landscape health can lead to input cost savings or access to new markets.
🥾 Tips from farmers: Monitoring budgets
Michael Baldry
Michael Baldry monitors one third of his 30 monitoring sites each year, which spreads the cost out whilst collecting meaningful data on his practices.
Gillian Sanbrook
Gillian Sanbrook invests her time in doing the monitoring herself, making it practical, affordable and meaningful. Gillian found she could not justify the cost of outsourcing long-term monitoring with the agistment focus in her business. ‘More importantly, it was not the financial cost. It was that I took my eye off the ball and I was getting a report each year that I did not have any ownership of,’ Gillian explains.
Jake Ryan
Jake Ryan spends $120 plus freight per sap test. Monitoring is an investment that pays for itself for Jake because it helps him to know which inputs the crop needs and when, without applying excess, which can also contribute to deficiencies of other minerals. Jake’s Planfarm8Planfarm is a farm business consultancy that offers benchmarking. benchmarking data shows that his profitability has increased from the bottom 25% of his benchmarking group to the top 25% in the last 8 years. Monitoring to inform input decisions and improve plant health is a big part of this improvement.
Schedule the time to monitor
Some monitoring takes only a few minutes, like snapping a photo at the same spot every season or pulling out a crop plant to check root biomass. Other assessments, like taking soil tests, pasture assessments or biodiversity surveys, might take a few hours or a day. Any monitoring is better than none, and you can start small. Choose what suits your goals and scale, and remember you don’t need to do everything at once. See the Choosing monitoring practices section for more on the main soil, plant and landscape monitoring options, tests and tools.
It is always important to allow a generous amount of time for monitoring and not rush through the process, especially the first time you monitor a site, as it takes the longest. Soil monitoring can be fun, so choose a time of year with good weather and take the time to enjoy the process. Some farmers pack a picnic and enjoy being out in nature for the day. Having company and help also makes the process faster and more enjoyable.
💡 Tips and tricks: Fitting monitoring into your schedule
- Rather than treating monitoring as a separate task, weave it into an existing part of your production calendar, like spending a few hours doing an annual soil health assessment and sampling before planting in spring each year.
- Take photos. They’re quick, visual and powerful over time. Try editing the photo in your phone with a text label so you can keep track of when/where/what is in the photo over time. Keep some monitoring equipment, like a shovel, infiltration ring and ruler, in the farm vehicle so it’s on hand when you are out observing the landscape.
- Use the same notebook or phone app to jot quick observations so nothing is lost.
- Consider working with a friend, a farming group or a consultant to hold you accountable. If you invest in professional support, it is recommended to join them for the monitoring to build your own skills and confidence.
🥾 Tips from farmers: How to make the time for monitoring
Michael Baldry
Michael Baldry and Geoff monitor two sites per day, taking between five and seven days to complete the monitoring. Geoff collates the monitoring data from the field using an electronic form as he carries out the soil aggregation and bulk density measurements in the shed. Geoff explains, ‘We try to do our measurements around September when there’s a fair bit of soil moisture and it makes the whole process a lot easier. Biology is also more active then.’ They invest a large amount of time each year in monitoring, so they only continue recording measurements that are useful to them.
Gillian Sanbrook
Gillian Sanbrook includes monitoring as part of the yearly farm operational calendar. ‘I do it because I think it’s something you should do, if you say it’s a job in September you just do it, like you have breakfast every morning. It’s one of those jobs like checking your bank statement at the end of the month,’ she says. Gillian feels timing is important so she monitors in September each year because ‘there is some moisture in the soil, you can identify plants and it is a nice time of year to go out’.
Jake Ryan
Jake Ryan uses an agronomist to take the plant sap test samples for him to make sure it gets done even if he’s too busy. The agronomist takes plant sap tests on a Monday or Tuesday, and results come back nine to ten days later, ready by the following Wednesday or Thursday. Vegetable crops are sap tested fortnightly so he can address nutrient deficiencies before they show up and save money by not applying nutrients that are not needed.
Jake sap tests pastures before they plan on doing a foliar fertiliser application. He looks at the long-range weather forecast and times the sap test ahead of a week of fine weather so the results are back in time for them to apply the foliar fertiliser during that window. Sometimes they also sap test after they have applied the foliar fertiliser to pastures.
‘I think you are better off going out and applying foliar fertiliser than you are sitting around waiting and being late on applying it,’ says Jake. ‘Ideally I would like to apply a foliar fertiliser to the pastures four times throughout the growing season, approximately every four to six weeks, and maybe one extra application of nitrogen or sulphur when trying to get the plants growing in June and July when it is cold and wet.’
Jake takes Brix readings occasionally through the season, as needed, using them alongside visual crop inspections to provide more information when a crop is looking good or when it is looking poor.
Jake takes soil tests once per year on the sites in paddocks that are going into a vegetable rotation. This means every paddock is sampled every five years prior to liming.
Create a monitoring kit
As you start to develop a regular monitoring practice, having your monitoring equipment stored in a tub in one place so it is ready to pick up and go makes the process easier. The equipment needed in your kit will depend on the monitoring tests you plan to do. Once you have decided on your monitoring indicators, you can develop an equipment list to check that the items are all in the kit before you head out to the paddock. This helps save time that would otherwise be wasted if you get out in the paddock and find something is missing.
👉 Find out more: Organise your monitoring kit
- Soil HASH 1 Manual: includes a section on organising your equipment
🥾 Tips from farmers: Soil monitoring kits
Michael Baldry
Michael Baldry and Geoff have collected a range of tools to form a basic soil monitoring kit. ‘We have a spot in the shed for it and it makes it easier for us when we come back to it every year,’ says Geoff.
‘You can pick up the monitoring tools online easily,’ Michael adds.
David Hardwick has also supplied them with custom-made metal rings for testing water infiltration.
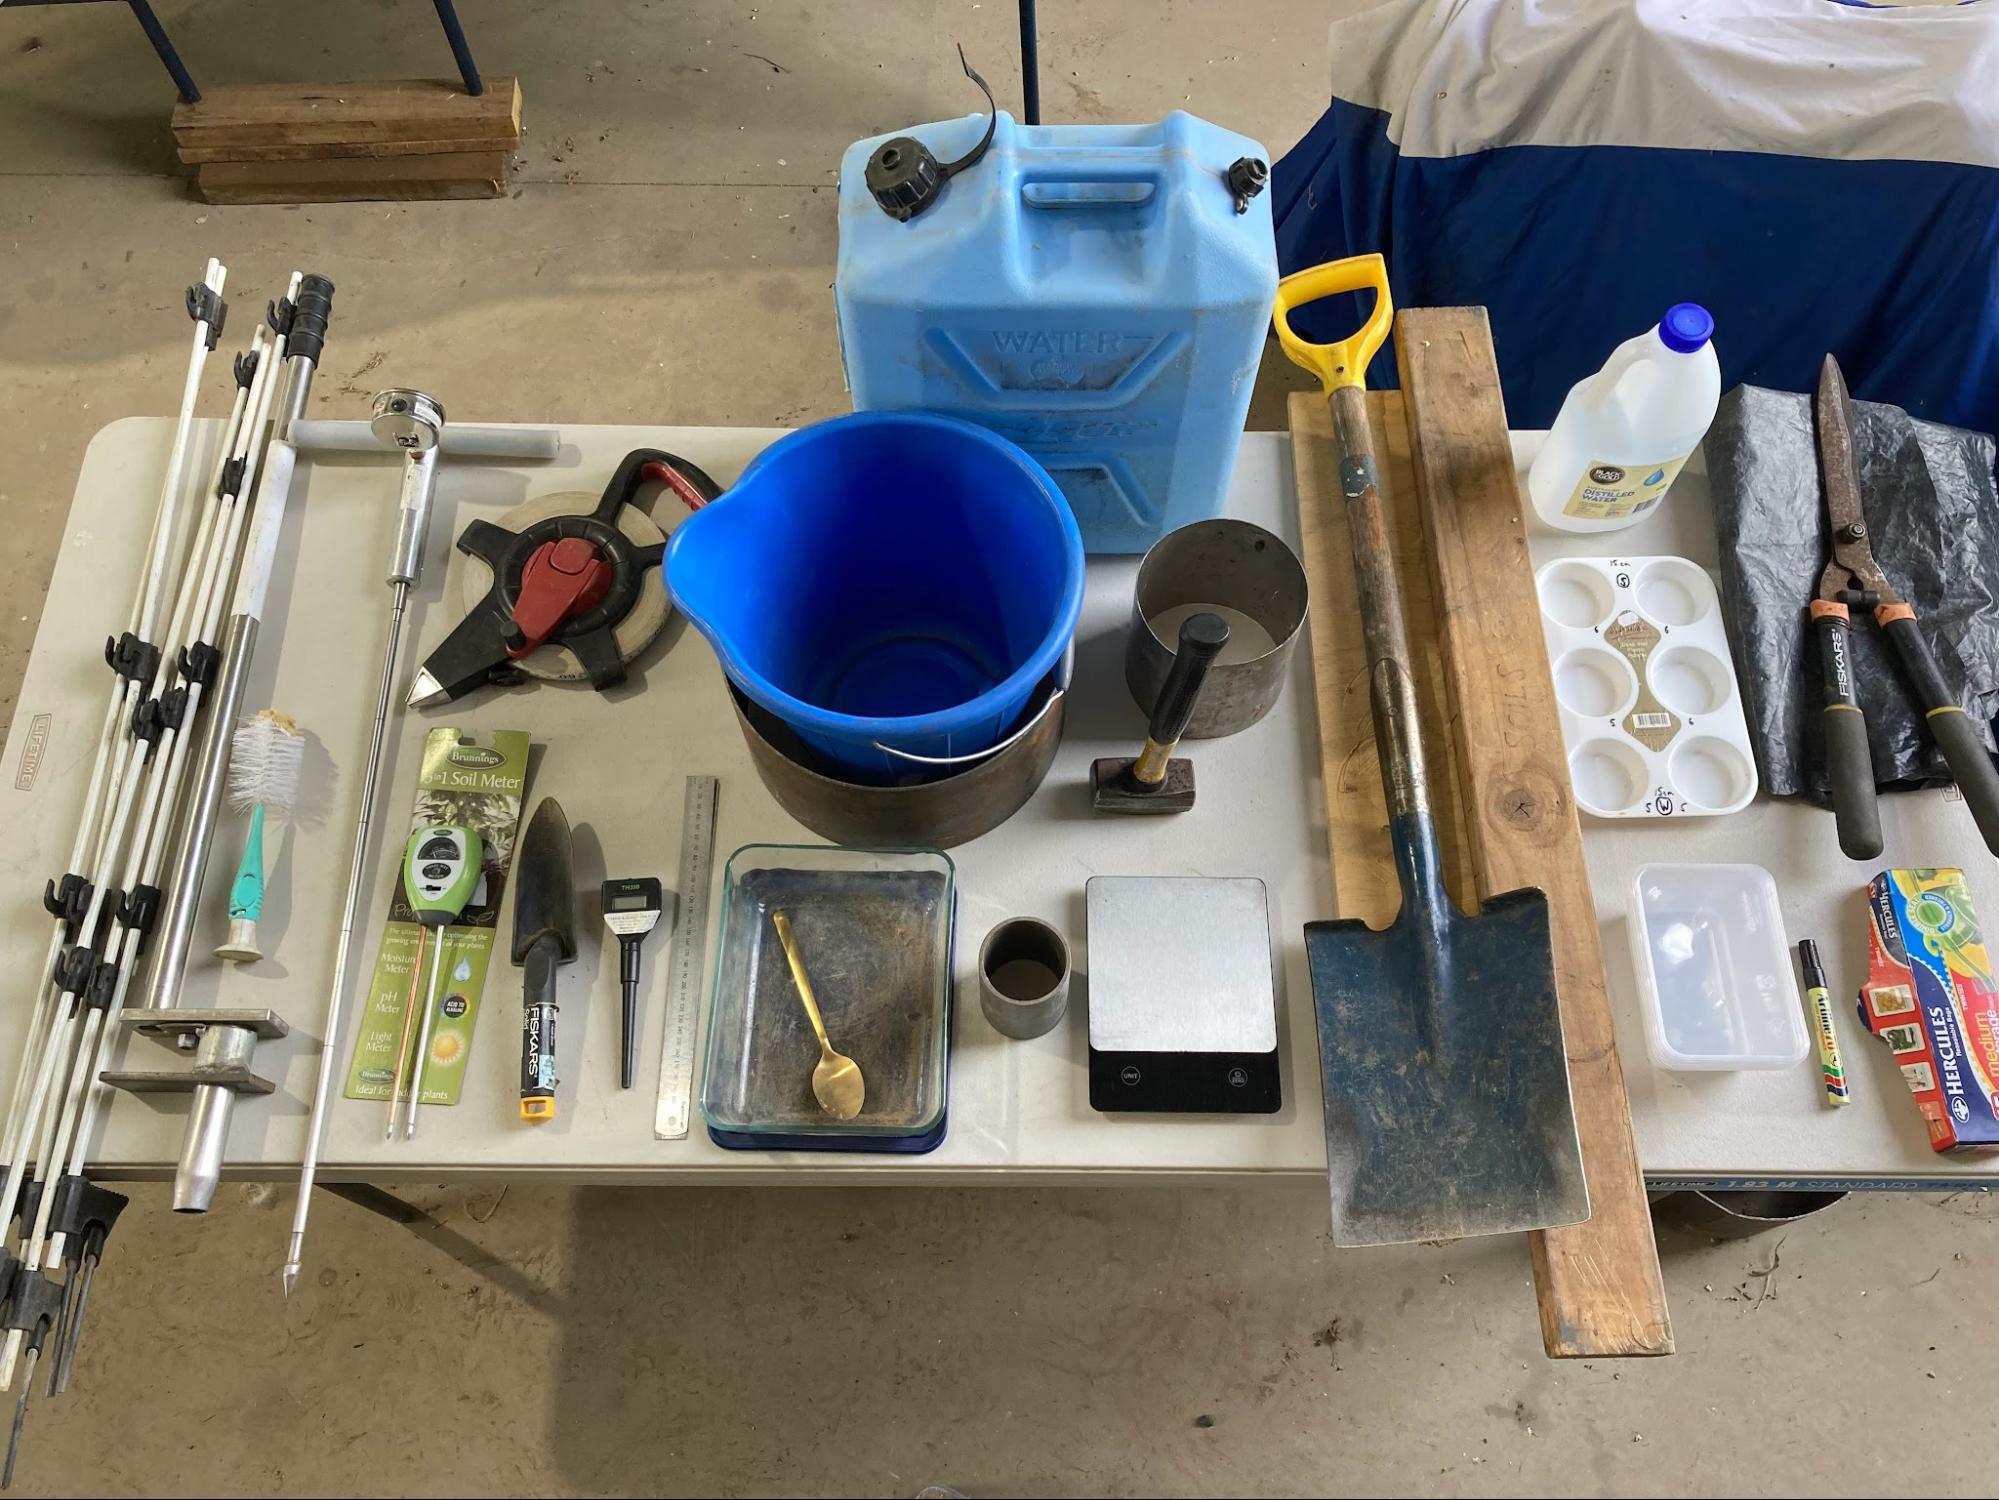
Image 12. The monitoring kit used at Michael Baldry’s. From left to right: posts for marking the site, core sampler, brush for sampler, penetrometer, tape measure, moisture probe, hand trowel, probe thermometer, steel ruler, water container, bucket, infiltration rings, hammer and timber for knocking in rings, microwave-proof tray for bulk density, scales to 1 g, spade, timber for slope measurement, plastic containers for samples (e.g. aggregate stability), jug of water, permanent marking pen, ziplock bags for lab samples, plastic sheet and shears. The kit packs into a large plastic tub. Source: Michael Baldry.
Gillian Sanbrook
Gillian Sanbrook keeps her monitoring equipment in a tub ready to pick up and take out into the paddock. Gillian’s monitoring kit contains:
- A spade
- A ruler
- A tape measure
- A temperature probe
- Equipment for water infiltration testing: a heavy hammer, a timber board and 25 L of water
- Trays and distilled water for aggregate stability and dispersion tests
- Soil pH test kit
- Clipboard, notebook and pencil
- Plant identification book
- Sample bags
- Mobile phone for GPS location and photographs
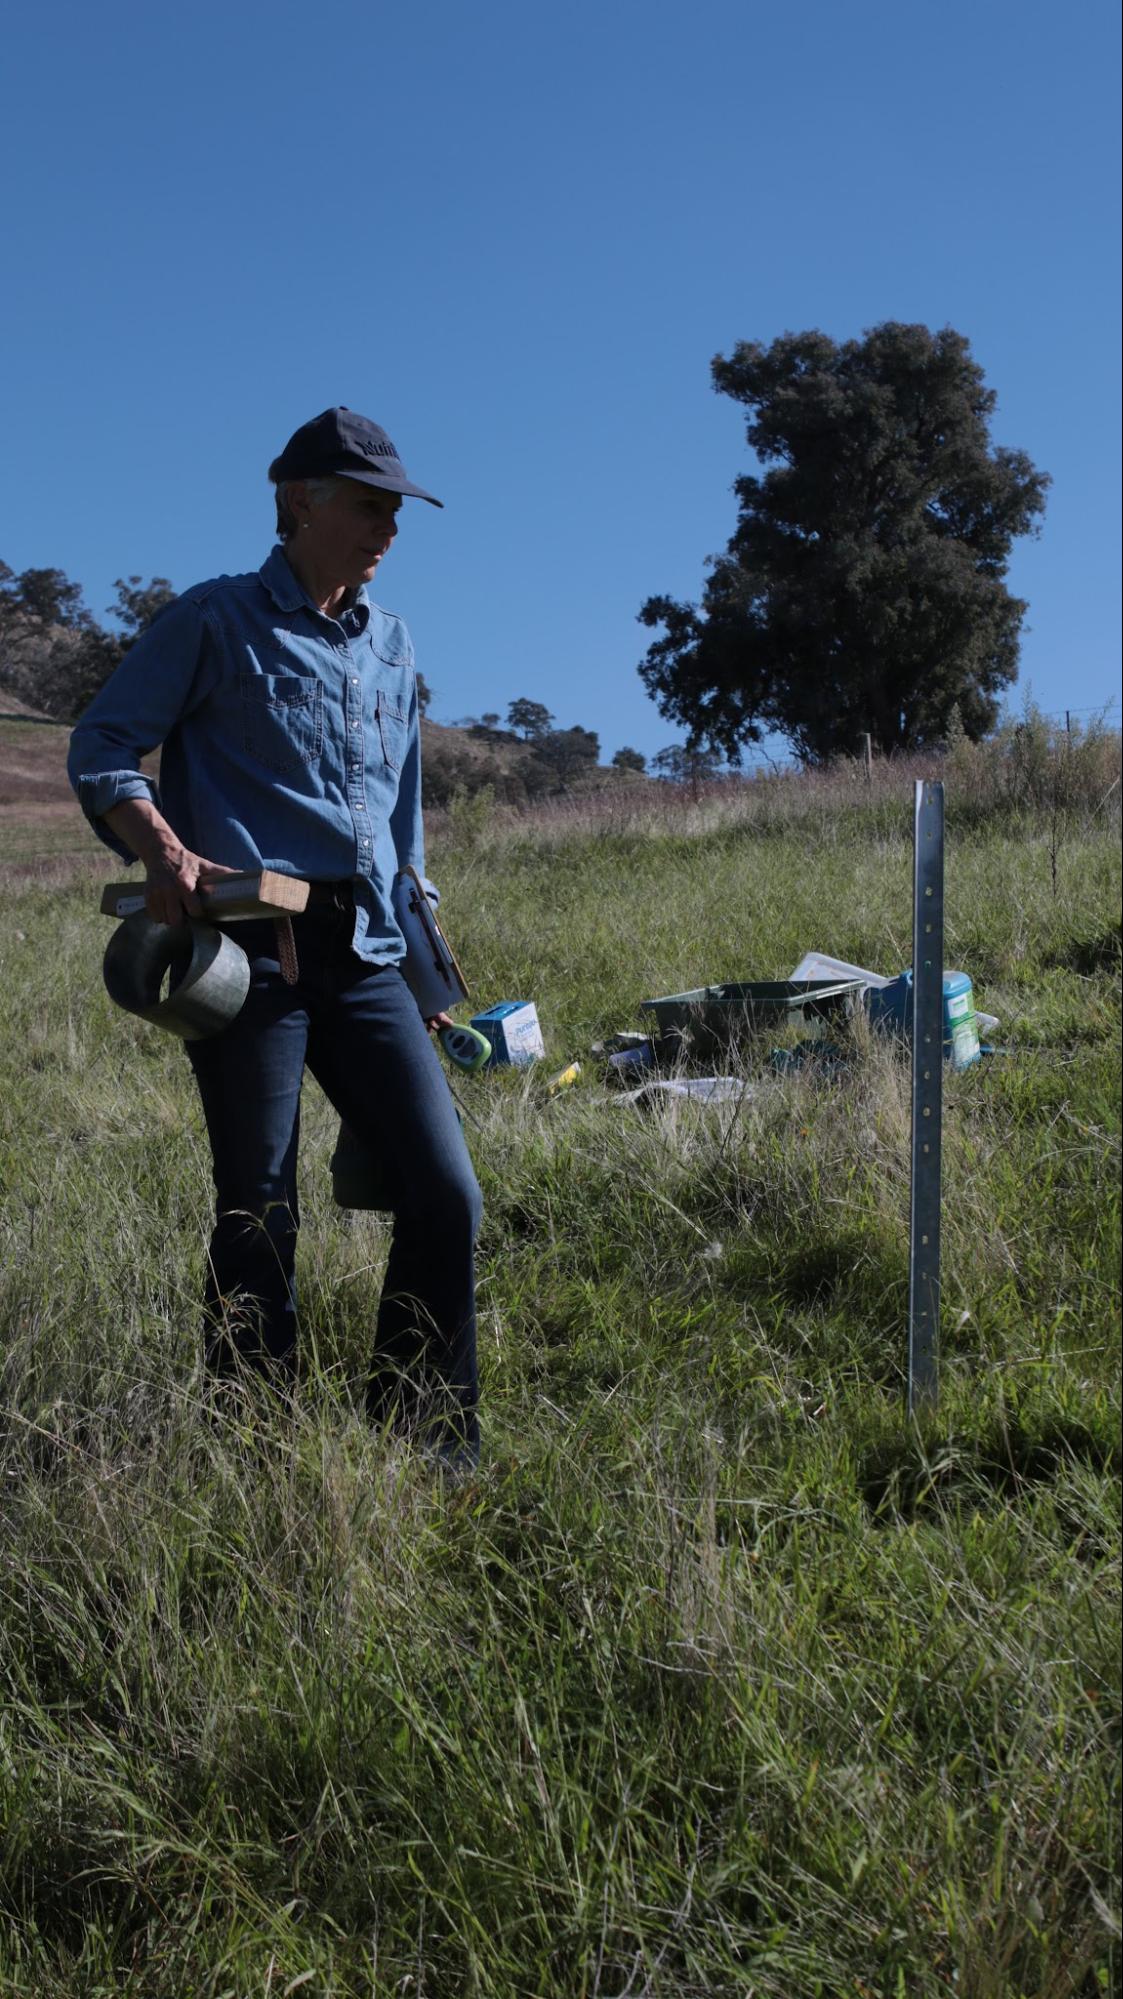
Image 13. Gillian with her monitoring equipment set up in the field, ready to start monitoring. Source: Grow Love Project.
Choosing monitoring practices
There are many measurements that can indicate soil, plant and landscape health. Soil, plants and landscapes are complex systems and all the indicators of health are interrelated. No single individual measurement can universally capture soil, plant or landscape health across all farming systems and contexts. A collection of indicators is always more useful.
Suggestions for selecting monitoring practices:
- Remember to start simple. You may wish to choose three to five tests from the lists below, or choose one soil monitoring resource to guide you.
- Choose practices that align with why you are monitoring, the questions you are asking and the decisions you are making to help you to collect data that is useful, actionable and relevant.
- Choose measures that cover the interrelated components of soil. Measuring aspects of soil physical health, biological health and chemical health, including a plant indicator and a landscape indicator, will build a more holistic picture.
- Choose practices you have the time, budget and skills to measure.
A number of excellent free resources that provide detailed information on how to undertake the monitoring practices have been included throughout this practice guide. This guide will connect you with the best resources to find out how to monitor soil, plant and landscape health in the field.
🥾 Tips from farmers: Choosing what they monitor
Michael Baldry
Michael Baldry is interested in learning and understanding the links between grazing management, soil health, production and biodiversity outcomes and wants to know what is going on in the landscape. He looks for how his management is increasing soil carbon, and measures soil health indicators that will improve production. Michael sees water infiltration as being the key to making money on the farm and wants to see how his management is helping to maximise the infiltration of rain into the soil and minimise runoff.
Michael is planning to use the monitoring data he has collected over the past six years to show trends and to help identify underperforming paddocks and inform the plan for improving them. He is also curious to see if cover crops have influenced compaction or soil health.
Gillian Sanbrook
Gillian Sanbrook focuses on monitoring indicators that are practical, meaningful and aligned with her Holistic Management context and interests.
‘I pick a few things, I only do what is relevant to me,’ she explains.
Gillian wants to know if the landscape function is improving, and looks for data that supports her grazing decision making. At present this includes ground cover, water infiltration, slaking and dispersion, rooting depth, worm counts and photographs.
Gillian explains how her biggest insight from monitoring is the reminder to get out there and observe. Routinely observing and monitoring her grazing plan is part of this. ‘If I can see I’m grazing faster than I had planned I know that I have got to start making changes,’ says Gillian.
For Gillian, monitoring has evolved and expanded over time beyond soil to include bird and dung beetle counts and natural capital assessments.
Jake Ryan
Jake Ryan prioritises monitoring methods that provide rapid feedback to inform decision making in relation to crop nutrition. Jake had issues with how foliar fertiliser products on the market were always a combination of nutrients, making it hard to address specific deficiencies. Guided by plant sap analysis, he can now make fertilisers targeting the exact needs of the crop, including trace elements like molybdenum, cobalt, or selenium, which are rarely available as a single formulation. He values the ability to apply precisely what he wants.
Jake also monitors sap analysis, Brix levels, soil chemistry and mycorrhizal fungi colonisation to inform longer term decision making regarding crop variety choice and profitability.
Monitoring soil health
Get to know your soil characteristics, variability and landscape
Monitoring soil, plant and landscape change is made easier by starting with a solid understanding of what types of soil are on your property and where your farm sits in the broader landscape and ecology of your region. Knowing your soil types and where they sit in the landscape can help inform where to monitor, how to interpret results and what management questions to ask. For example, you would consider different monitoring locations if your landscape includes deep and fertile river flat soils compared to one with slopes that are prone to erosion and thin, vulnerable soils.
Soil characteristics
A good place to start is by understanding soil texture and cation exchange capacity. These are inherent characteristics of soil that change very little over time and cannot be changed by management practices. These properties vary by location and are influenced by the type of rocks from which the soil has formed and the soil’s position in the landscape. These characteristics provide insight into how soil holds water and nutrients, what land use the soil is best suited for, and how to maximise its potential and minimise the risk of soil degradation.
Soil texture
Soil texture is the proportion of sand, silt and clay in the soil, which affects its water and nutrient holding capacity. Soil texture is easy to assess in the field by wetting some soil in your hands and observing how it feels and behaves.
👉 Find out more: Methods for assessing soil texture in the field
- Field measurements to determine soil texture: how to do the ribbon test
- Dirt shake activity for determining soil texture by mixing soil and water in a jar, shaking it and leaving it to settle.
Cation exchange capacity
Cation exchange capacity (CEC) is a measure of the soil’s ability to hold onto positively charged ions (i.e. cations), such as calcium, magnesium, potassium, sodium and aluminium. Higher CEC means greater nutrient storage. CEC increases with the soil’s clay and organic matter content and is related to soil texture, with lighter, sandier textured soils having lower CECs and heavier clay soils having higher CECs.9NSW Department of Primary Industries and Regional Development, Cation Exchange Capacity, accessed 23 September 2026. CEC is measured in the laboratory through analysis of a soil sample.
Soil profile
A soil profile is a vertical cross-section of the soil that shows the different layers, or horizons, that build up from the surface down to the parent material. Each horizon within a soil profile can have a different texture, and not all horizons are always present in every soil profile. The Australian Soil Quality Knowledge Base explains, ‘For example, three soils may have the same sandy surface, but one remains sandy with depth (deep sand), another gradually increases in clay (sandy earth), and the third has a layer of sand over a layer of clay (duplex)10Soil Quality Knowledge Base, Soil groups and soil classification, accessed 23 September 2026..’ Understanding the soil profile in your landscape is important because differences in soil texture, and therefore CEC, through the depth of the profile can affect how soils behave and are best managed.
Table 1. Characteristics of soil layers, or horizons, in the soil profile.*
| Soil horizon | Characteristics |
| Topsoil / A Horizon | The uppermost part of a soil (often the cultivated layer) that contains the majority of organic matter, plant-available nutrients and soil organisms. The depth of this layer can vary and is influenced by management and climate. |
| Subsoil / B Horizon | Often differs from the A horizon in colour, texture and structure, and can be relatively infertile. Material in this horizon predominantly accumulates through leaching, where water moves down through the soil profile and deposits minerals, nutrients or fine particles carried from the layers above, and is therefore influenced by soil porosity and rainfall. In many soils, the B horizon contains higher amounts of clay than the A horizon. The depth and water holding capacity of this horizon greatly affect the value of the soil for plant growth. |
| Parent material / C Horizon | Parent material is rock, partly decomposed rock or soil materials deposited many thousands of years ago. If the soil is shallow and the C horizon is rock, plant roots cannot penetrate and growth is restricted. In weathered (decomposed) rock, plant roots can generally find their way down through the cracks and crevices. |
*Soil Quality Knowledge Base, Soil groups and soil classification, accessed 23 September 2026.
Observing soil profile in the field
Observing the soil profile commonly involves digging a soil pit to identify the horizons, textures and pH levels at depth as a way to understand soil characteristics, best uses and soil constraints. There are other ways to do this without excavating a large area of soil, including observing the soil profile at natural or man-made exposed faces such as river banks or road cuts. Taking a soil sample at depth using a hydraulic soil corer can also show differences in colour, texture, root depth and pH at depth.
👉 Find out more: Soil CRC Fact Sheet and Webinar: Soil characterisation using a soil pit
Using soil maps for soil classification information
Soil groups and soil classification maps can help identify and understand the soil profiles across a landscape. It is always advisable to ground-truth these soil maps through in-field observations.
👉 Find out more:
- Soil Science Australia: Australian Soil Classifications
- Soil Quality Knowledge Base: Soil groups and soil classification, includes Australian Soil Classification and Soil Groups of Western Australia
- Soil Science Australia: Soils data, maps and information sources
Identify the limitations to production for each soil type
Getting to know your soil texture, CEC and soil profile will help you understand the properties of your soil, including which aspects of soil health you are most able to change and which are likely to be beyond your capacity to influence.
Table 2. Properties of different soil textures.*
| Property | Texture grades | ||||
| Sands | Sandy loams | Loams | Clay loams | Clays | |
| Total available water | Very low to low | Low to medium | High to medium | Medium to high | Medium to low |
| Infiltration | Very fast | Fast to medium | Medium | Medium to slow | Slow |
| Nutrient supply capacity | Low | Low to medium | Medium | Medium to high | High |
| Leachability | High | High to moderate | Moderate | Moderate to low | Low |
| Tendency to hard setting or surface sealing | Low | High | High to moderate | Medium | Medium to low |
| Susceptibility to compaction | Low | Moderate | Moderate to high | Low | High |
*Department for Environment and Water, ‘Understanding the properties of South Australian agricultural soils’, Department for Environment and Water – Soils of South Australia, 2021, accessed 23 September 2026.
Soil health indicators
Soil health indicators are measurable properties of soils that can be used to assess soil health and function. Soil health consists of physical, chemical and biological factors that are interrelated.
- Physical properties of soils relate to the ability of the soil to support plant growth by allowing root growth, drainage, aeration and retention of moisture and plant nutrients.11T Goldammer, ‘Organic Crop Production’, Chapter 4: Soil management on organic farms: Soil Properties. APEX Publishers, 2017, accessed 23 September 2026.
- Biological properties of soils are related to the diversity of organisms that make up the soil food web, including bacteria, fungi, algae, protozoa, nematodes, micro-arthropods, earthworms, insects and small invertebrates.12T Goldammer, ‘Organic Crop Production’, Chapter 4: Soil management on organic farms: Soil Properties. APEX Publishers, 2017, accessed 23 September 2026. These organisms help to decompose organic matter, cycle nutrients and support plant health.13MyLand, ‘Introduction to soil properties: three key traits every grower should know’, 2024, accessed 23 September 2026.
- Chemical properties of soils reflect the ability of the soil to hold and supply nutrients for plant growth.14T Goldammer, ‘Organic Crop Production’, Chapter 4: Soil management on organic farms: Soil Properties. APEX Publishers, 2017, accessed 23 September 2026.
Soil health monitoring in the field
Visual soil health assessments performed in the paddock are a simple and cost-effective way to understand soil health. These are best carried out once a year, or every two years at a minimum. Combining these in-field assessments with laboratory testing can provide a complete picture of soil health and function.
Photo points
A photo point at the monitoring site helps record the context and conditions, as well as track changes over time. Including a landscape shot and a close-up of ground cover gives a more complete picture, while photos of the soil profile capture changes in soil structure and colour over time.15D Hardwick & R de Lastic, ‘Soil HASH 1 Manual’, Soil Land Food, 2025.
For a really simple approach to photo point monitoring check out the Soils for Life Soil Health Assessment Guide and Record Sheet.
Physical soil health indicators
Topsoil depth: The topsoil is the upper layer of the soil where plant roots, soil organic matter and soil microbes are most active. The deeper the topsoil, the better a soil functions.16D Hardwick & R de Lastic, ‘Soil HASH 1 Manual’, Soil Land Food, 2025.
Soil aggregate stability: Soil aggregate stability is the ability of soil aggregates to maintain their structure under stress. Stable aggregates hold together when placed in water, indicating the soil has a stable structure. Unstable aggregates can slake (fall apart) and disperse (make the water cloudy) when placed in water. Soil texture, organic matter, soil microbes and plant roots can influence soil slaking and dispersion. Dispersion can also be a sign of high sodium.17D Hardwick & R de Lastic, ‘Soil HASH 1 Manual’, Soil Land Food, 2025.
Water infiltration: Water infiltration measures how well the soil can absorb rainfall and provide water for plant growth and soil biological function. Infiltration is a function of soil texture, soil structure and pore spaces and can be an indirect measure of soil compaction.18Local Land Services NSW, Snapshot: A practical tool for assessing the current condition of your soil health, pasture condition, native vegetation and farm water, 2019.
Soil strength and compaction: Soil strength refers to the soil’s resistance to penetration or deformation, while compaction refers to the density of the soil, or how tightly soil particles are packed together. Both are influenced by soil texture and soil moisture and indicate the ease with which plant roots can grow and move through the soil.19Local Land Services NSW, Snapshot: A practical tool for assessing the current condition of your soil health, pasture condition, native vegetation and farm water, 2019. As soil strength and compaction increase, plant roots are impeded and their growth rate slows.
Biological soil health indicators
Soil smell: Healthy soils have a distinctive, ‘earthy’ smell due to actinobacteria and other beneficial microbes. The actinobacteria present in healthy soils produce geosmin, which in turn produces a distinctive slightly sweet smell. Unhealthy soils often have a sour or metallic smell.20Meat & Livestock Australia, Module 6: Healthy Soils, Key indicators of soil health, accessed 23 September 2026. No smell likely indicates a lack of biological life.21Noble Research Institute, ‘Simple ways to measure soil health improvements in real time’, accessed 23 September 2026.
Earthworm count: Earthworms play a major role in decomposing soil organic matter and cycling nutrients. Higher numbers of earthworms indicate conditions that are favourable for soil health and plant growth.22M Retallack, ‘The Great Aussie Ecovineyards Earthworm Count’, Retallack Viticulture, accessed 23 September 2026.23G Shepherd, ‘Visual Soil Assessment, Volume 1, Field guide for cropping and pastoral grazing on flat to rolling country’, Landcare Research, 2000.
Soil organism diversity: Soil organism diversity refers to the presence and variety of earthworms, dung beetles, springtails, ants, nematodes, mites, potworms, millipedes and other visible invertebrates. Having a rich diversity of soil organisms is important for soil health, as they contribute to mineral cycling, maintaining soil structure and regulating pests and diseases.24D Hardwick & R de Lastic, ‘Soil HASH 1 Manual’, Soil Land Food, 2025.
👉 Find out more: How to measure biological soil health indicators in the field
- Soils for Life Soil Health Assessment Guide and Record Sheet: includes how to measure soil organisms.
- Soil HASH 1 Manual: includes how to measure soil organisms and how to measure topsoil depth.
- The Great Aussie Ecovineyards Earthworm Count: how to count and identify commonly found earthworms in Australia.
Chemical soil health indicators
Soil pH: Soil pH indicates the acidity or alkalinity of the soil, which is related to nutrient availability and plant species suitability.25P Hazelton and B Murphy, ‘Interpreting soil test results. What do all the numbers mean? Third Edition’, CSIRO Publishing, 2016. A pH of 7 is neutral, while less than 7 is acidic and greater than 7 is alkaline. In the field, soil pH can be measured using a kit available from nurseries, hardware stores and rural suppliers. In-field kits test pH measured in water and should be used only as a guide to soil pH, compared with pH measured in calcium chloride (CaCl2) solution, which is a more consistent laboratory measurement (see Soil laboratory testing).26B Lake, Understanding soil pH, NSW Department of Primary Industries and Regional Development, 2000. Accessed 30 September 2026.
💡 Tips and tricks: Monitoring resources
There are a number of resources that provide instructions on how to monitor soil health in the field. It helps to print the resource you will use in the field in colour, laminate the pages to make them weather-proof and store them in a ring binder in your soil monitoring kit.
Two of the simplest resources to start with are:
Soils for Life Soil Health Assessment Guide and Record Sheet
Five quick and easy field methods to assess the health of your soil:
- Photopoints
- Groundcover
- Water infiltration
- Aggregate stability
- Soil organisms
- Groundcover
- Water infiltration
- Aggregate stability
- Soil pH
- Topsoil depth
- Soil organism diversity
👉 Find out more: Soils for Life videos
👉 Find out more: If you want to dig deeper some more advanced resources for monitoring soil health in the field include:
Soil laboratory testing
Laboratory testing provides detailed information on the underlying characteristics of your soil, including nutrient deficiencies, excesses and imbalances. Laboratory testing can also identify microbial diversity and composition, including active and total bacteria, fungi, protozoa, nematodes and mycorrhizal fungi. The frequency of soil testing depends on how the results are used to inform decision making, and can range from yearly testing to three- to five-year intervals.
Bulk density: Bulk density is the weight of soil in a given volume, which provides an indication of the soil’s physical condition. It increases with compaction and depth, with high bulk density reflecting reduced pore space in the soil. This can limit the ability of plant roots, water and air to move through the soil and increase the risk of runoff and waterlogging.27K Brown and A Wherrett, ‘Fact Sheets: Bulk Density – On Farm Use’, Soil Quality, accessed 23 September 2026.
pH: Soil pH indicates the acidity or alkalinity of the soil which is related to nutrient availability and plant species suitability.28P Hazelton and B Murphy, ‘Interpreting soil test results. What do all the numbers mean? Third Edition’, CSIRO Publishing, 2016. A pH of 7 is neutral, while less than 7 is acidic and greater than 7 is alkaline.
Laboratory testing provides the most accurate measurement of soil pH.29B Lake, Understanding soil pH, NSW Department of Primary Industries and Regional Development, 2000. Accessed 30 September 2026. There are two different forms of pH lab tests: pH measured in water or pH measured in calcium chloride (CaCl2) solution. Results in calcium chloride solution give a lower value than pH measured in water and are closer to the true soil pH in the field. When comparing results over time, it is important to be consistent with the same pH laboratory test.30Soil Quality Knowledge Base, Soil pH, 2024, accessed 30 September 2026.
Electrical conductivity (EC): EC measures the electrical conductivity through the soil solution, which indicates soil salinity. A higher EC generally means a greater concentration of dissolved salts, which can affect plant water uptake and growth.31N Palombi and D Blaesing, ‘Soil test interpretation guide for dryland pastures in Tasmania’, accessed 23 September 2026.
Soil organic carbon: Soil organic carbon is a measure of the carbon contained within soil organic matter, which includes decomposing plant, animal and microbial material. Soil organic carbon supports nutrient cycling and microbial activity, helps to aggregate soil particles (i.e. improve structure) to provide resilience to physical degradation, increases water storage and availability to plants and protects soil from erosion.32Agriculture Victoria, ‘Soils and carbon for reduced emissions’, 2023, accessed 23 September 2026.
Cation exchange capacity (CEC): CEC measures how well the soil is able to hold and exchange positively charged ions, known as cations, such as calcium, magnesium, potassium, sodium and aluminium. It provides a buffering effect to changes in pH, available nutrients, calcium levels and soil structural changes. CEC influences soil structure, nutrient availability, soil pH and the soil response to fertilisers and soil amendments.33P Hazelton and B Murphy, ‘Interpreting soil test results. What do all the numbers mean? Third Edition’, CSIRO Publishing, 2016. CEC increases with clay and organic matter content so lighter, sandier textured soils tend to have a lower CEC, while heavier clay soils tend to have a higher CEC.34NSW Department of Primary Industries and Regional Development, Cation Exchange Capacity, accessed 23 September 2026. CEC is usually estimated by displacing the exchangeable cations (calcium, magnesium, potassium and sodium) with another strongly adsorbed cation, and then determining how much of the strongly adsorbed cation is retained by the soil.35P Hazelton and B Murphy, ‘Interpreting soil test results. What do all the numbers mean? Third Edition’, CSIRO Publishing, 2016.
Soil nutrient levels and ratios: Several lab tests analyse nutrient levels in the soil to identify deficiencies, excesses or imbalances. Common nutrients tested for include nitrogen, phosphorus, potassium, calcium, magnesium, sodium and trace elements.
Soil biology testing: Soil biology testing can measure the abundance, types or activity of organisms in the soil. Different methods, such as DNA, phospholipid fatty acid (PLFA), microscopy, respiration and enzyme testing, measure different parts of the soil biological system. These tests can help to build a picture of the soil food web and track how soil biology responds to management.
💡 Tips and tricks: Integrating laboratory testing with in-field monitoring
There is no single metric for soil health, so combining laboratory testing and in-field monitoring can build a more complete picture of physical, chemical and biological soil health. This helps guide decision making around strategies for addressing soil constraints, and provides feedback on whether management practices are having beneficial or harmful impacts on soil health. We can integrate in-field and laboratory tests by:
- Using in-field monitoring to decide where to sample for laboratory testing
- Monitoring in-field and laboratory tests at the same location and time
- Interpreting laboratory test results alongside in-field monitoring to help correlate what you see with the numbers
- Tracking both laboratory tests and in-field monitoring over time
- Using in-field monitoring yearly between laboratory testing cycles, when laboratory testing occurs every few years.
Monitoring plant health
Plant health indicators
Plant indicators are measurable characteristics that are used to assess the health, growth and condition of plants. In pastures, indicators such as groundcover, pasture biomass, plant density, species composition and growth rate can be used to monitor changes in pasture condition over time. At the individual plant level, characteristics such as root growth, nutrient deficiencies, drought stress, pest attack, disease, Brix, sap pH and legume nodulation can be used in the field to monitor changes over time. Laboratory testing can also be used to identify nutritional deficiencies and guide fertiliser decisions.
Plant health monitoring in the field
Observing plant health in the field reveals how well the overall soil and plant system is functioning, including whether plants can access the minerals in the soil. The types of plants growing can also point to underlying soil constraints.
Pasture indicators
Ground cover: Ground cover is any plant material that covers bare soil and protects it from exposure, degradation and erosion. A high percentage of ground cover also helps maintain soil temperature and soil organic matter, reduces evaporation of water and provides a habitat for soil biology.36D Hardwick & R de Lastic, ‘Soil HASH 1 Manual’, Soil Land Food, 2025.
Pasture composition: Pasture composition or diversity refers to the mix of different plant species growing in a pasture, and can be measured as the proportion of annual grasses, perennial grasses, legumes, and broad-leaved plants. Composition is an indication of pasture ecosystem health and helps to ensure year-round quality feed for livestock and improved climate resilience.37L Kahn and J Earl, ‘Pasture Management Checklist for the Northern Tablelands of NSW’, Agricultural Information and Monitoring Services, 2021.
Quantity of pasture: Pasture quantity is the herbage mass of a pasture measured in kilograms of dry matter per hectare (kg DM/ha), and is used to calculate feed budgets and set appropriate stocking rates.38L Kahn and J Earl, ‘Pasture Management Checklist for the Northern Tablelands of NSW’, Agricultural Information and Monitoring Services, 2021.
Pasture growth rate: Pasture growth rate measures the quantity of pasture growth over time and is expressed in kilograms of dry matter produced per hectare per day (kg DM/ha/day). It is measured by calculating the change in pasture quantity over a set period, taking into account the average stocking rate over that same period.39L Kahn and J Earl, ‘Pasture Management Checklist for the Northern Tablelands of NSW’, Agricultural Information and Monitoring Services, 2021.
Weeds: Monitoring and recording weed populations can provide insight into whether current management strategies are working. Weeds that germinate in the paddock reflect soil physical, chemical and biological conditions and can indicate soil compaction, waterlogging and low biological activity, as well as nutrient cycling, deficiencies and excesses.40D Sandborn, ‘Weeds Are an Indicator of a Soil’s Health’, Michigan State University Extension, 15 August 2016, accessed 26 June 2026.
👉 Find out more:
- AIMS Pasture Checklist: A 12-step checklist assessment for assessing pasture performance and health in the field.
- Soils for Life Practice Guide: Grazing for soil and landscape regeneration. Includes examples of how graziers monitor pastures for grazing planning.
Individual plant indicators
Rooting depth, health and density: Rooting depth, health and density refers to how deep plant roots grow into the soil, how healthy and well-developed they are, and how many roots are present within a given area of soil. Plant roots can be examined by digging a 20 cm square hole to a depth of 20 cm and lifting the soil out to reveal whether soil compaction is restricting plant root growth and limiting access to nutrients and moisture.41Soilcare, ‘Northern Rivers Soil Health Card’, 2024.
Nutrient deficiencies: Visual signs of nutrient deficiencies, such as changes in colour, dead tissue, stunted growth or deformities, are a helpful diagnostic tool, but by the time visual signs are evident, the deficiency is well advanced. It is worth confirming these signs with laboratory testing of soil or plant leaf tissue.
Plant drought stress: Visual signs of drought stress in plants, such as wilting, are a late-stage indicator that photosynthesis and transpiration are compromised due to lack of water.
Insect pests and diseases: The presence of plant pests and diseases can indicate overall plant health and help identify and resolve challenges early. Since healthy plants can better resist pests and disease, their presence can be a valuable indicator of plant nutrition.42Advancing Eco Agriculture, ‘The plant health pyramid’, accessed 23 September 2026.
Brix: Brix is a measurement of the sugar content in plant sap, taken using a refractometer. Brix provides an indication of plant sugar levels, as well as overall plant nutritional health.43R Lemus and J White, ‘Brix level in your forage: what does it mean?’, Mississippi State University, 2022, accessed 23 September 2026.
Sap pH: Sap pH is a measure of the acidity or alkalinity of plant sap, tested using a pH meter. It can give an indication of the plant’s nutrient status as well as its disease and insect susceptibility. A sap pH of >6.4 is caused by an imbalance of anions nitrogen, phosphorus or sulfur and signals that insect attacks are highly likely, whereas a sap pH of <6.4 indicates a possible deficiency in cations calcium, magnesium, potassium and/or sodium, making disease problems likely.44J Kempf, ‘Sap pH as a susceptibility indicator’, 2021, accessed 23 September 2026.
Legume nodulation: Legume nodulation is the process of nodules forming on the roots of legumes, where nitrogen-fixing bacteria (rhizobia) convert atmospheric nitrogen into a form the plant can use. Checking whether roots are healthy and nodules are present and active can indicate whether legume plants are fixing nitrogen.45Meat & Livestock Australia, ‘Assessing nodulation in legumes: How to assess legume nodulation’, accessed 23 September 2026.
Plant laboratory testing
Laboratory testing provides information on how well the overall soil and plant system is functioning. Alongside soil tests, plant laboratory tests can indicate if plants are able to access the minerals in the soil.
Leaf tissue testing: Leaf tissue testing measures the total nutrients in dried plant matter, reflecting the accumulation of nutrients over time. Samples are usually taken from one leaf position on the plant (e.g. newest mature leaf). Leaf tissue tests often confirm nutrient deficiencies that are already visible and work best for evaluating soil health programs. There are established ranges of nutrients for most crops.46J Garley, ‘The difference between leaf tissue and sap analyses’, Progressive Crop Consultant, 2024, accessed 23 September 2026.
Plant sap testing: Plant sap testing measures dissolved nutrients in cell fluid, reflecting the current nutritional status of the plant. Sap testing requires both old and new leaves to be sampled and tested separately, and provides information on nutrient deficiencies before visual symptoms appear. Results are used to guide nutrient applications, and trends throughout the season help refine and adjust application protocols.47J Garley, ‘The difference between leaf tissue and sap analyses’, Progressive Crop Consultant, 2024, accessed 23 September 2026.
💡 Tips and tricks: Combine leaf tissue testing with soil testing
Taking leaf tissue tests during the active growing season, before going to seed and at the same sites and time as soil sampling, provides valuable data when combined with soil test results.
👉 Find out more:
- Getting started with sap analysis and foliars: a Soils for Life webinar with Tom Robinson and Mark Tupman.
- Plant sap testing and analysis: a recording of a Soils for Life webinar with Mark Tupman discussing sap testing on farms in South Australia.
Monitoring landscape health
In this section
Landscape health indicators
Broadening monitoring to include landscape health helps take a big-picture view of the whole farming ecosystem. This can reveal trends in landscape health over time, some of which can serve as early indicators of progress or early warnings that things are going backwards.
Soil and plant health indicators sit within the broader context of ecosystem and landscape health. Together, they contribute to the water cycle, mineral cycle and the capture of sunlight through photosynthesis, while the diversity of soil organisms and plants offers a measure of overall biodiversity.
Simple landscape monitoring methods
Land degradation: Identifying and monitoring areas of land degradation over time, such as erosion, waterlogging, areas of salinity or acidity, loss of organic matter and soil fertility decline, helps flag when land use is creating long-term problems and corrective measures should be taken.48NSW Department of Environment and Heritage, ‘Soil Degradation’, accessed 23 September 2026.
Biodiversity: Monitoring bird life, natural vegetation and beneficial insects such as pollinators can indicate how well the agricultural ecosystem is functioning, including whether current farming practices are degrading the ecosystem or regenerating it.
Whole farm visual landscape walks: Regular landscape walks are a good starting point for observing what’s happening on your property over time, which can be incorporated into your day-to-day activities. Some useful practices when walking the landscape include:
- Identifying where water and sediment moves and collects during rainfall events
- Noticing ground cover and soil surface crusting and condition
- Observing edge effects around paddocks.
Photo points: Establishing photo points is a simple method to monitor the farm landscape and record changes over time. Taking photos at least once in the growing season per year, at the same place and time of year is a good way to start. This can be expanded to include a photo once in the growing season and once in the non-growing season, since soil surface conditions can be harder to spot when vegetation cover is high. Monitoring in both seasons gives a more complete picture.
Whole of farm mapping: Creating a map using satellite imagery from sites like Google Earth or Cibo Labs can help record and track changes in the landscape over time.
👉 Find out more: Landscape monitoring resources
- Healthy Land & Water Photopoint monitoring guide: how to choose photopoint sites, take photopoint photos and record the details of your photopoint monitoring.
- MLA Establishing a new photo point: how to set up a photo point, take the photo and store your photos.
- Invertebrates Australia: for resources on monitoring and identifying invertebrates.
- BirdLife Australia: for bird identification and monitoring resources.
- Bird friendly farms: a guide for landholders to protect birds and their habitats on farms in rural landscapes of NSW.
- iNaturalist App: identify and learn about plants, animals and fungi in your landscape.
- NSW DPI Farm Tracker App: complete a simple crop, pasture or animal survey, keep and manage a photo diary of your farm so you can manage the same paddock over many years and generate reports.
- Ground cover monitoring for Australia: a website with national ground cover information for Australia.
- Cibo Labs: monitor pasture, feed availability, land condition and changes in ground cover and tree cover using satellite imagery.
🥾 Tips from farmers: How they monitor
Michael Baldry
Michael Baldry uses the HASH method because it provides ‘a simple, low cost way of doing a baseline and then measuring the progress of these indicators that will help production’.
Geoff explains how over time the process has become more efficient. ‘We’ve tried some tests for a year or two and then we’ve dropped them because they were too time-consuming, didn’t provide us with enough information or something superseded them,’ he says. ‘For example, the Metagen soil biology DNA analysis superseded our calico strip test that we were using as an indication of biological activity because that takes a lot of time.’
Michael and Geoff suggest that it is best to start with just a few tests. Michael recommends starting with water infiltration, penetrometer readings, ground cover, visible macro-organisms, earthworms, slaking and dispersion. Geoff says, ‘Keep it simple to start with. You can start really basic just by putting a spade in the soil and having a look at the soil and observing structure, topsoil depths and macro-organisms at a few different locations around the property.’
Gillian Sanbrook
Gillian Sanbrook started using the Holistic Management monitoring process, which focused on ground cover, perennial and annual plant counts, soil compaction and photo points. Over time she has refined the process into a small, targeted set of indicators using the HASH method. She says, ‘I really value monitoring, and the HASH method updates the Holistic Management monitoring, evolving the method.’
Gillian focuses on monitoring methods that are practical and enjoyable, and that connect directly to management decisions. She explains, ‘If it’s not interesting to me I won’t do it, so I have refined it down.’ She now monitors ground cover, photo points, soil pH, slaking and dispersion, water infiltration, rooting depth, worm counts and insect counts. She recently incorporated lab testing of soil biology every three years as part of a soil carbon project.
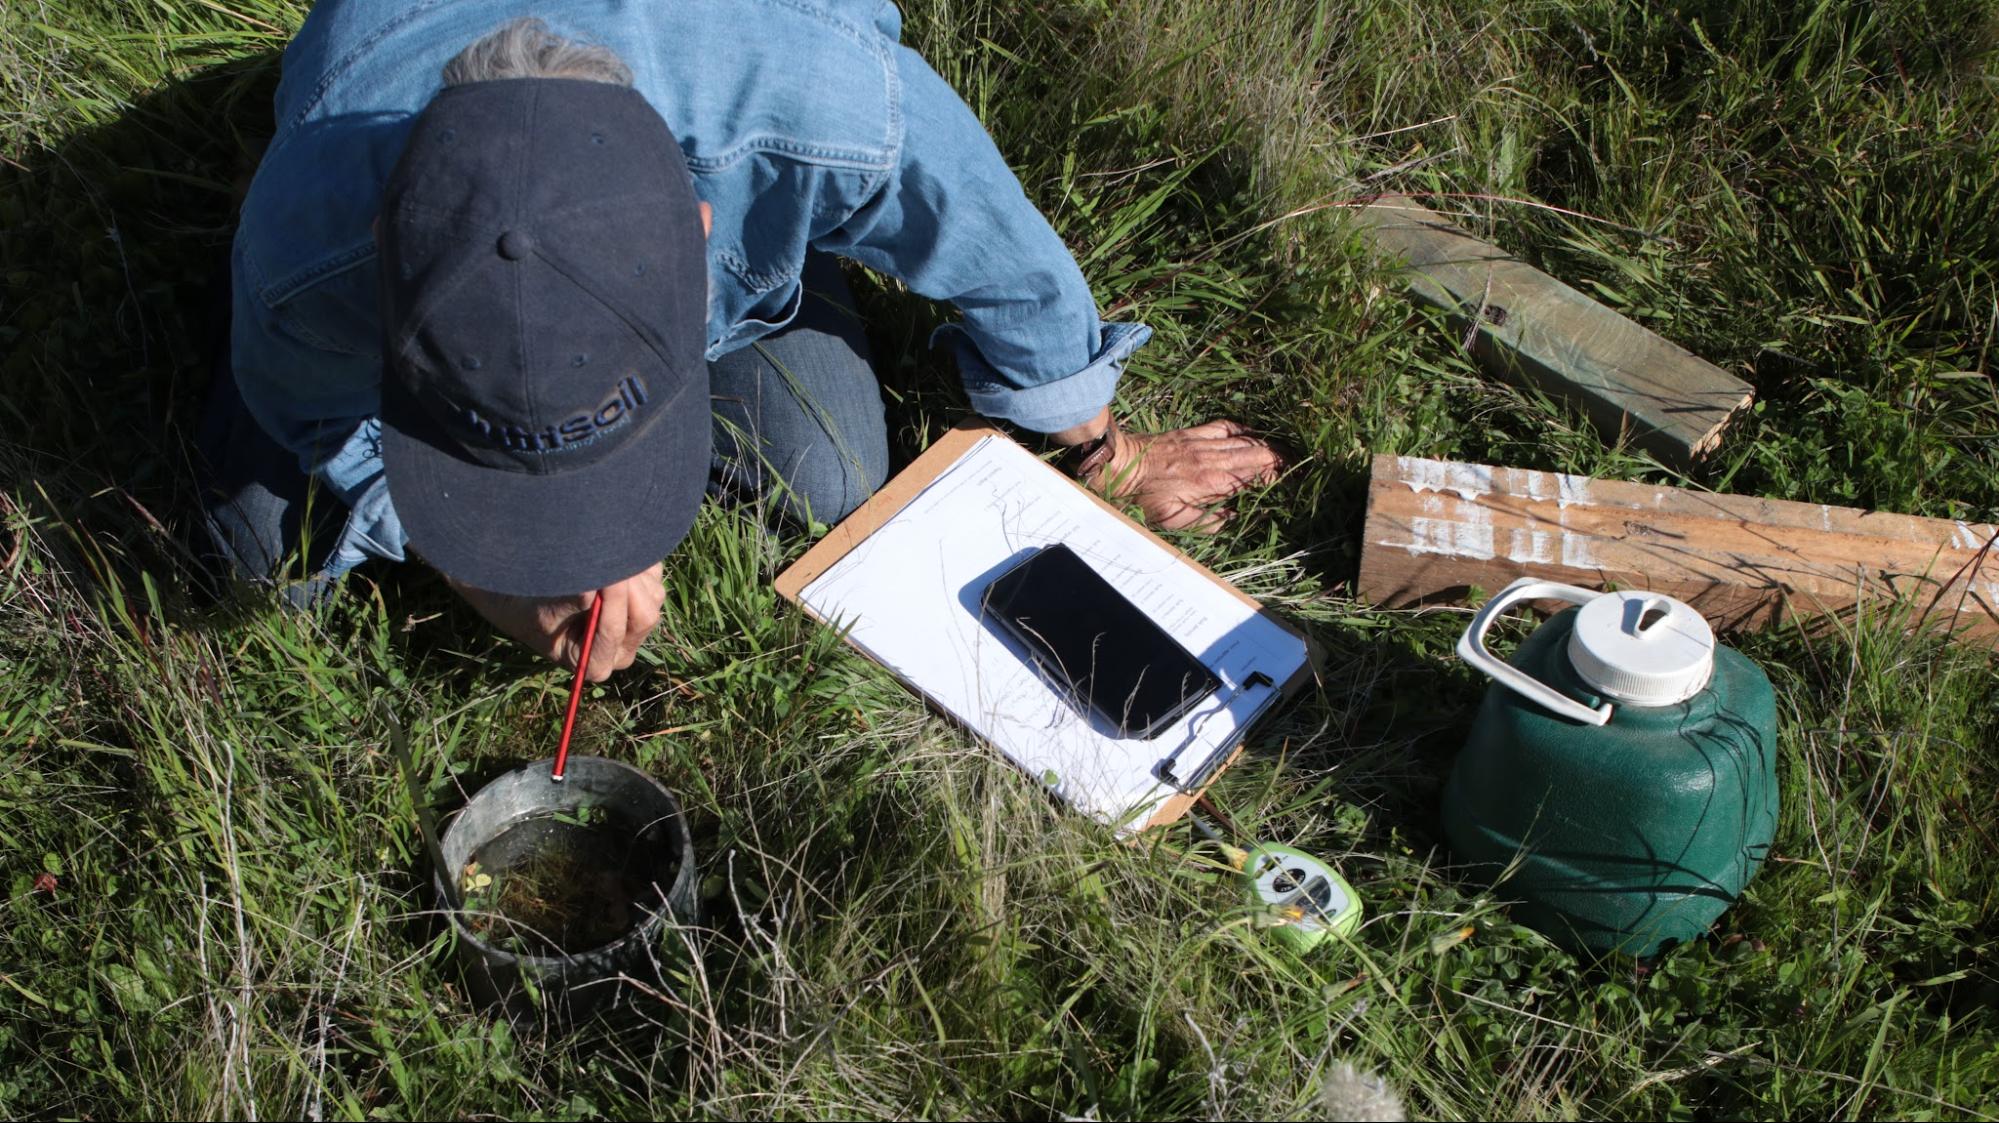
Image 14. Gillian Sanbrook measuring water infiltration rate at Bibbaringa. Source: Grow Love Project.
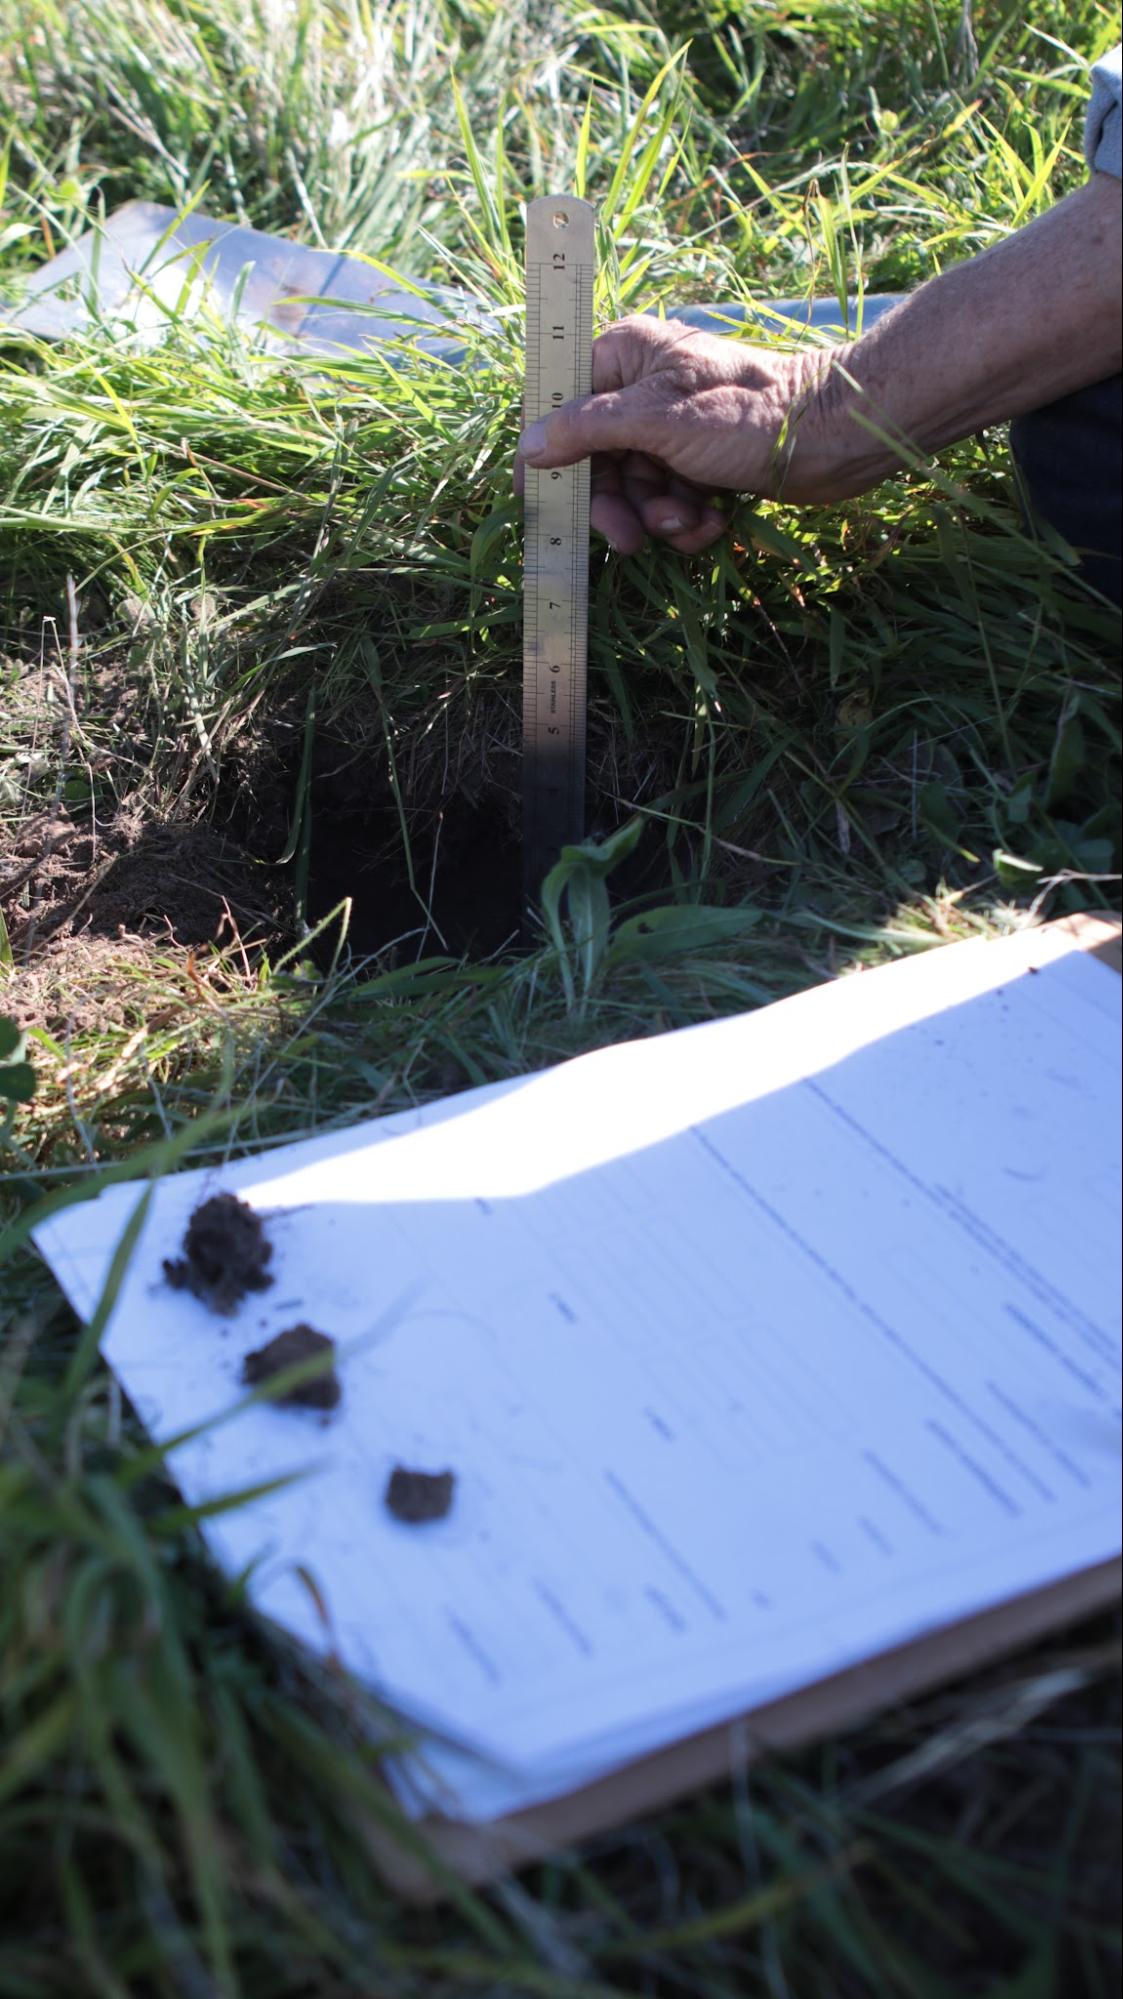
Image 15. Gillian Sanbrook monitoring rooting depth at Bibbaringa. Source: Grow Love Project.
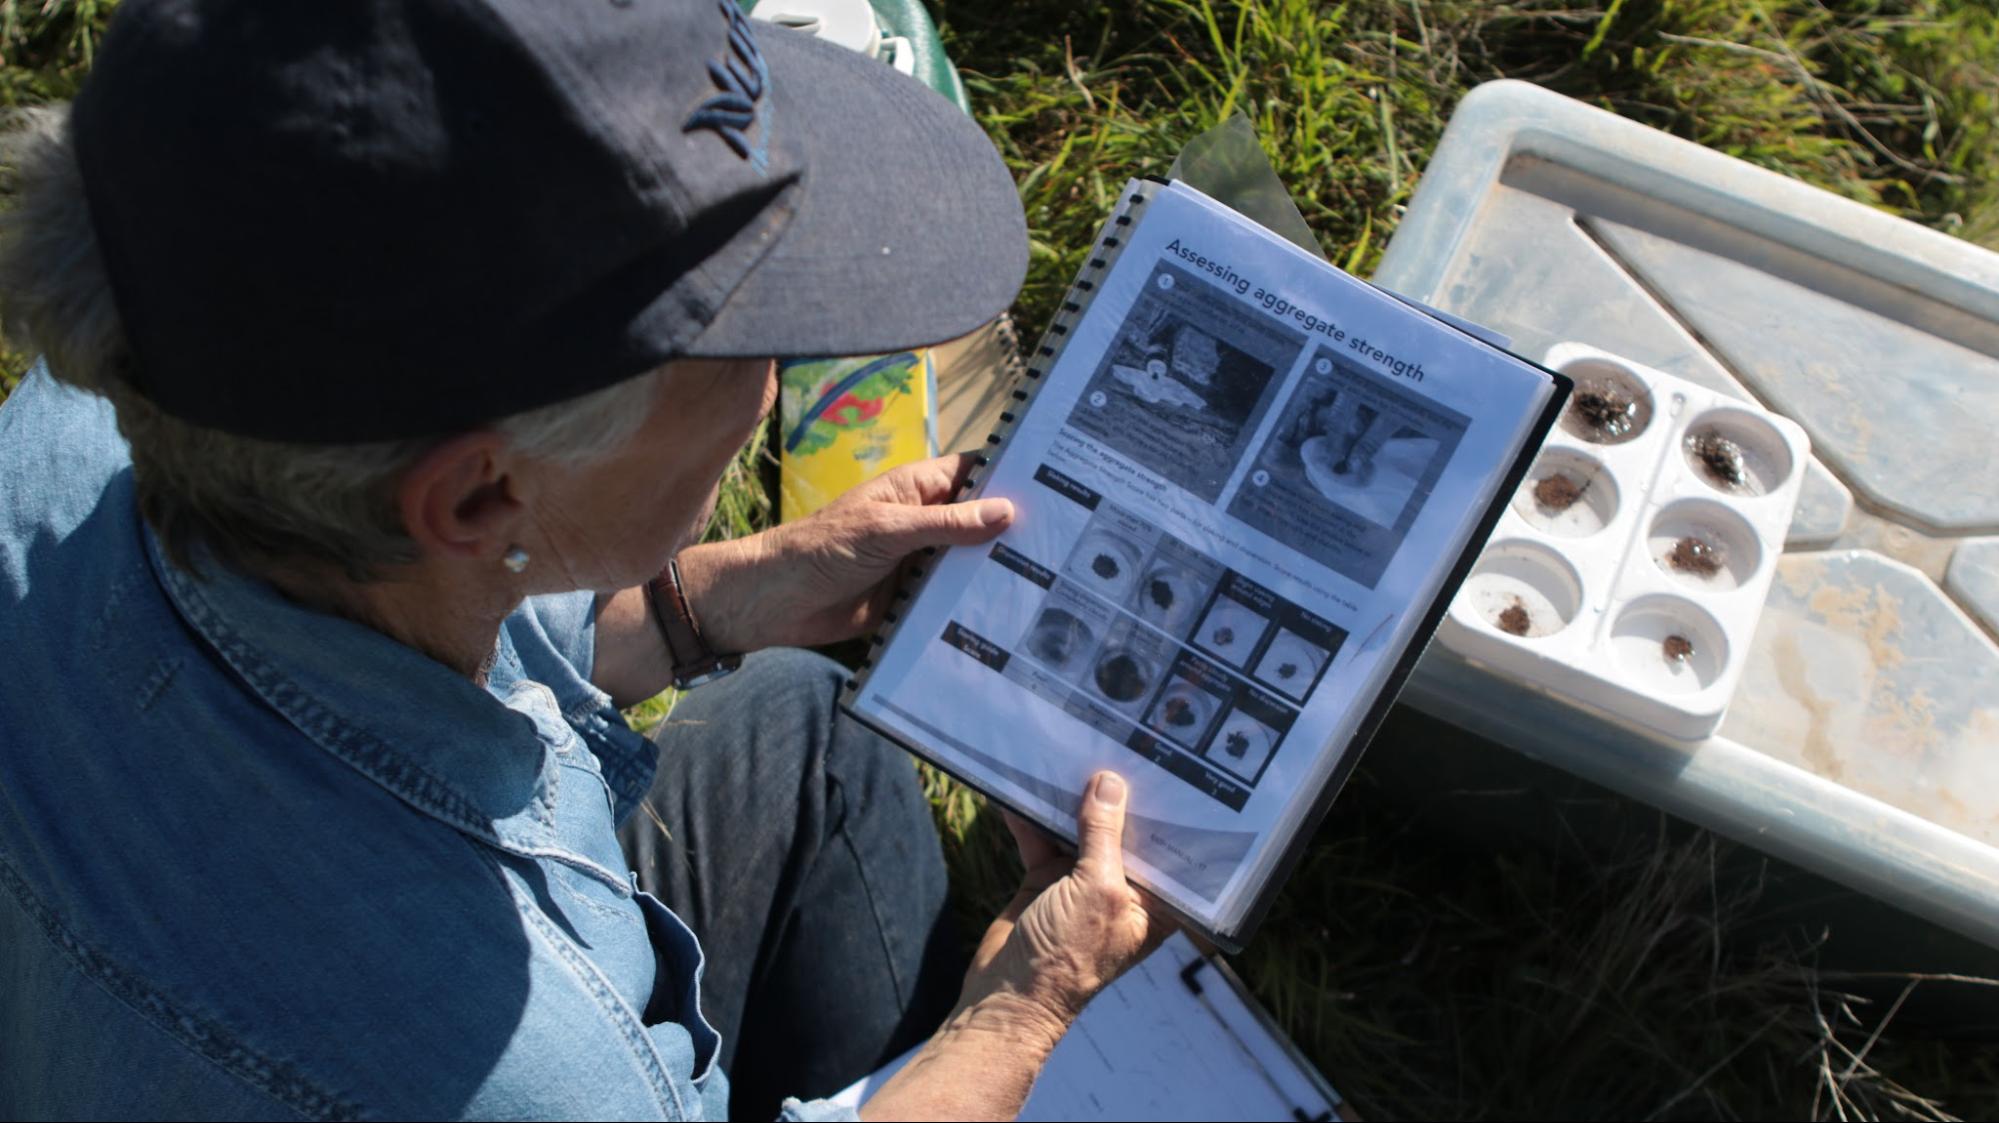
Image 16. Gillian Sanbrook measuring aggregate stability at Bibbaringa. Source: Grow Love Project.
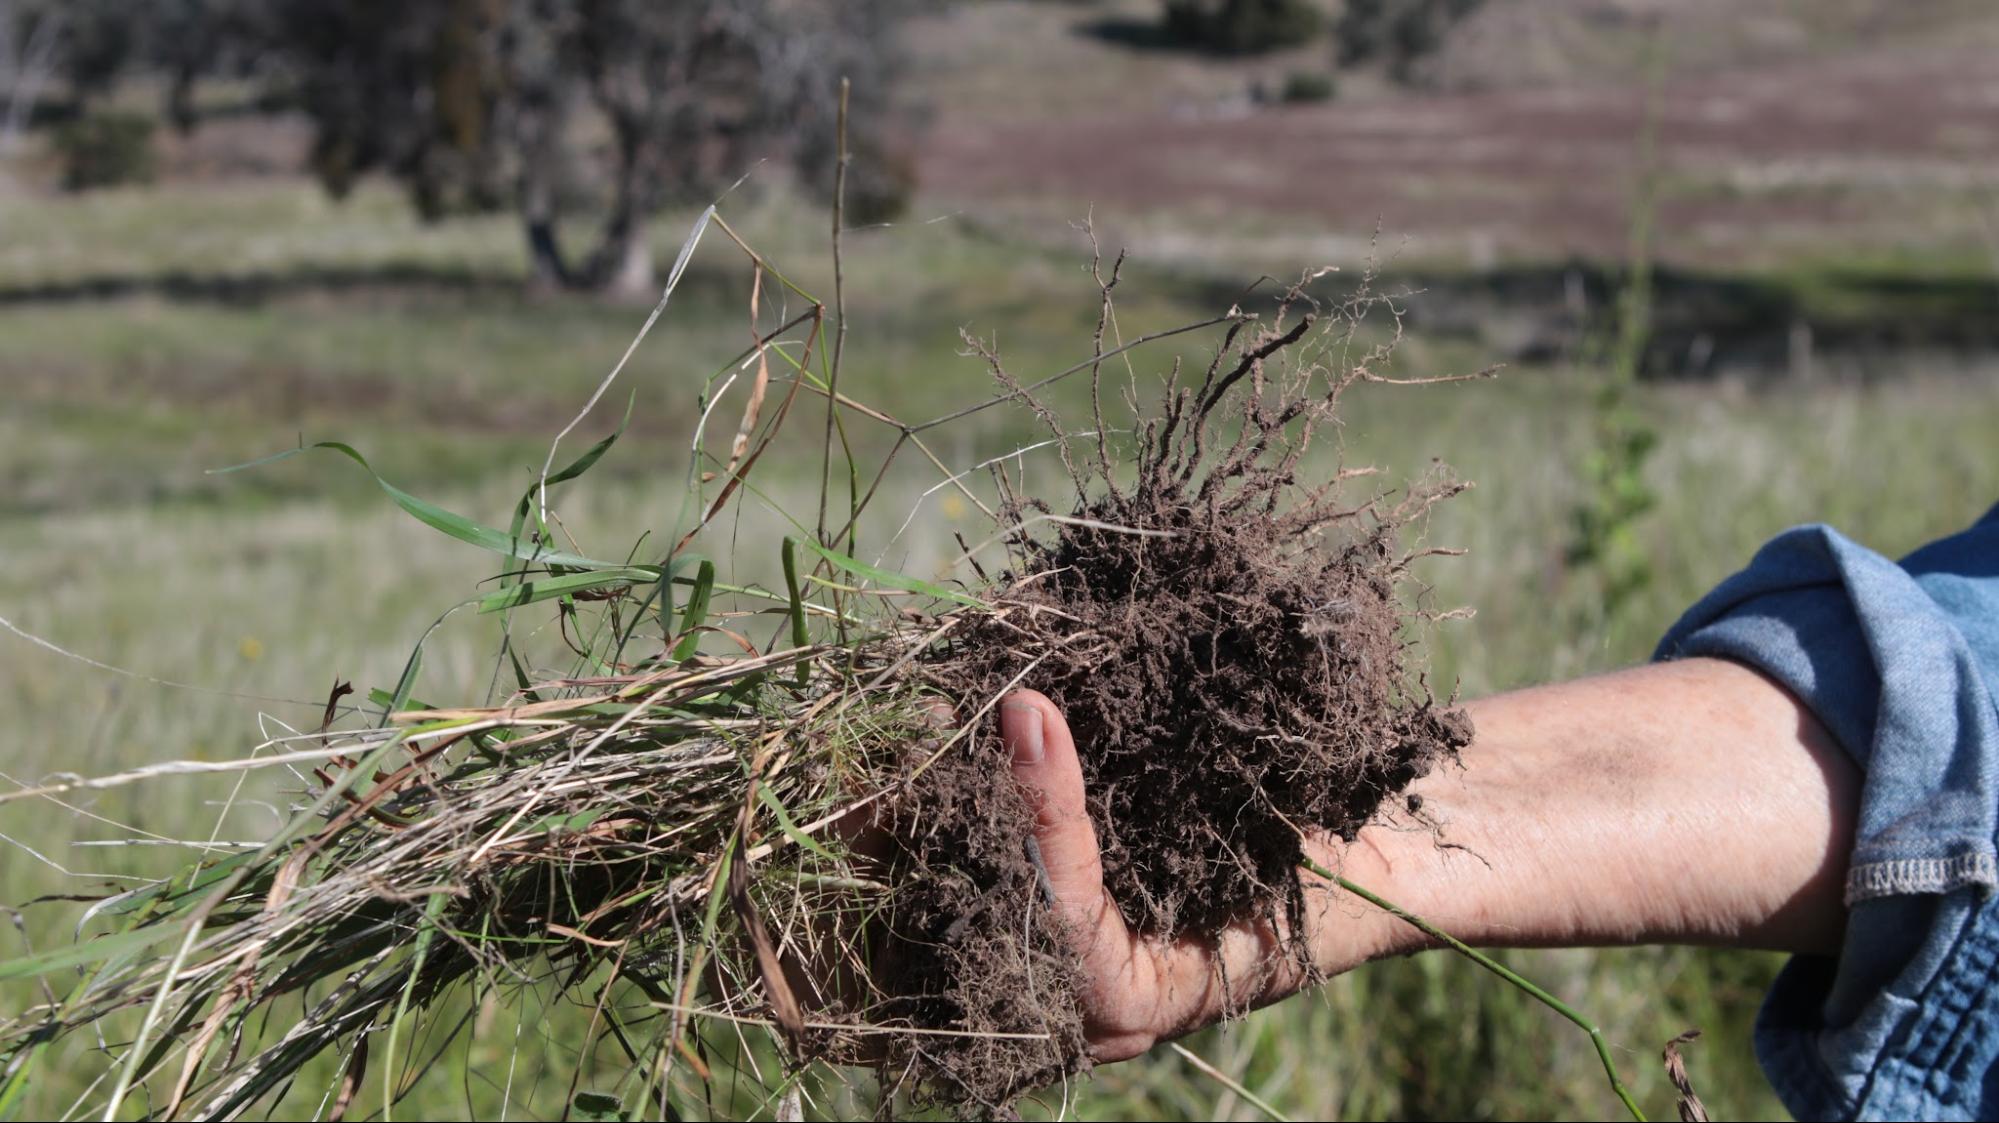
Image 17. Gillian Sanbrook observing plant roots at Bibbaringa. Source: Grow Love Project.
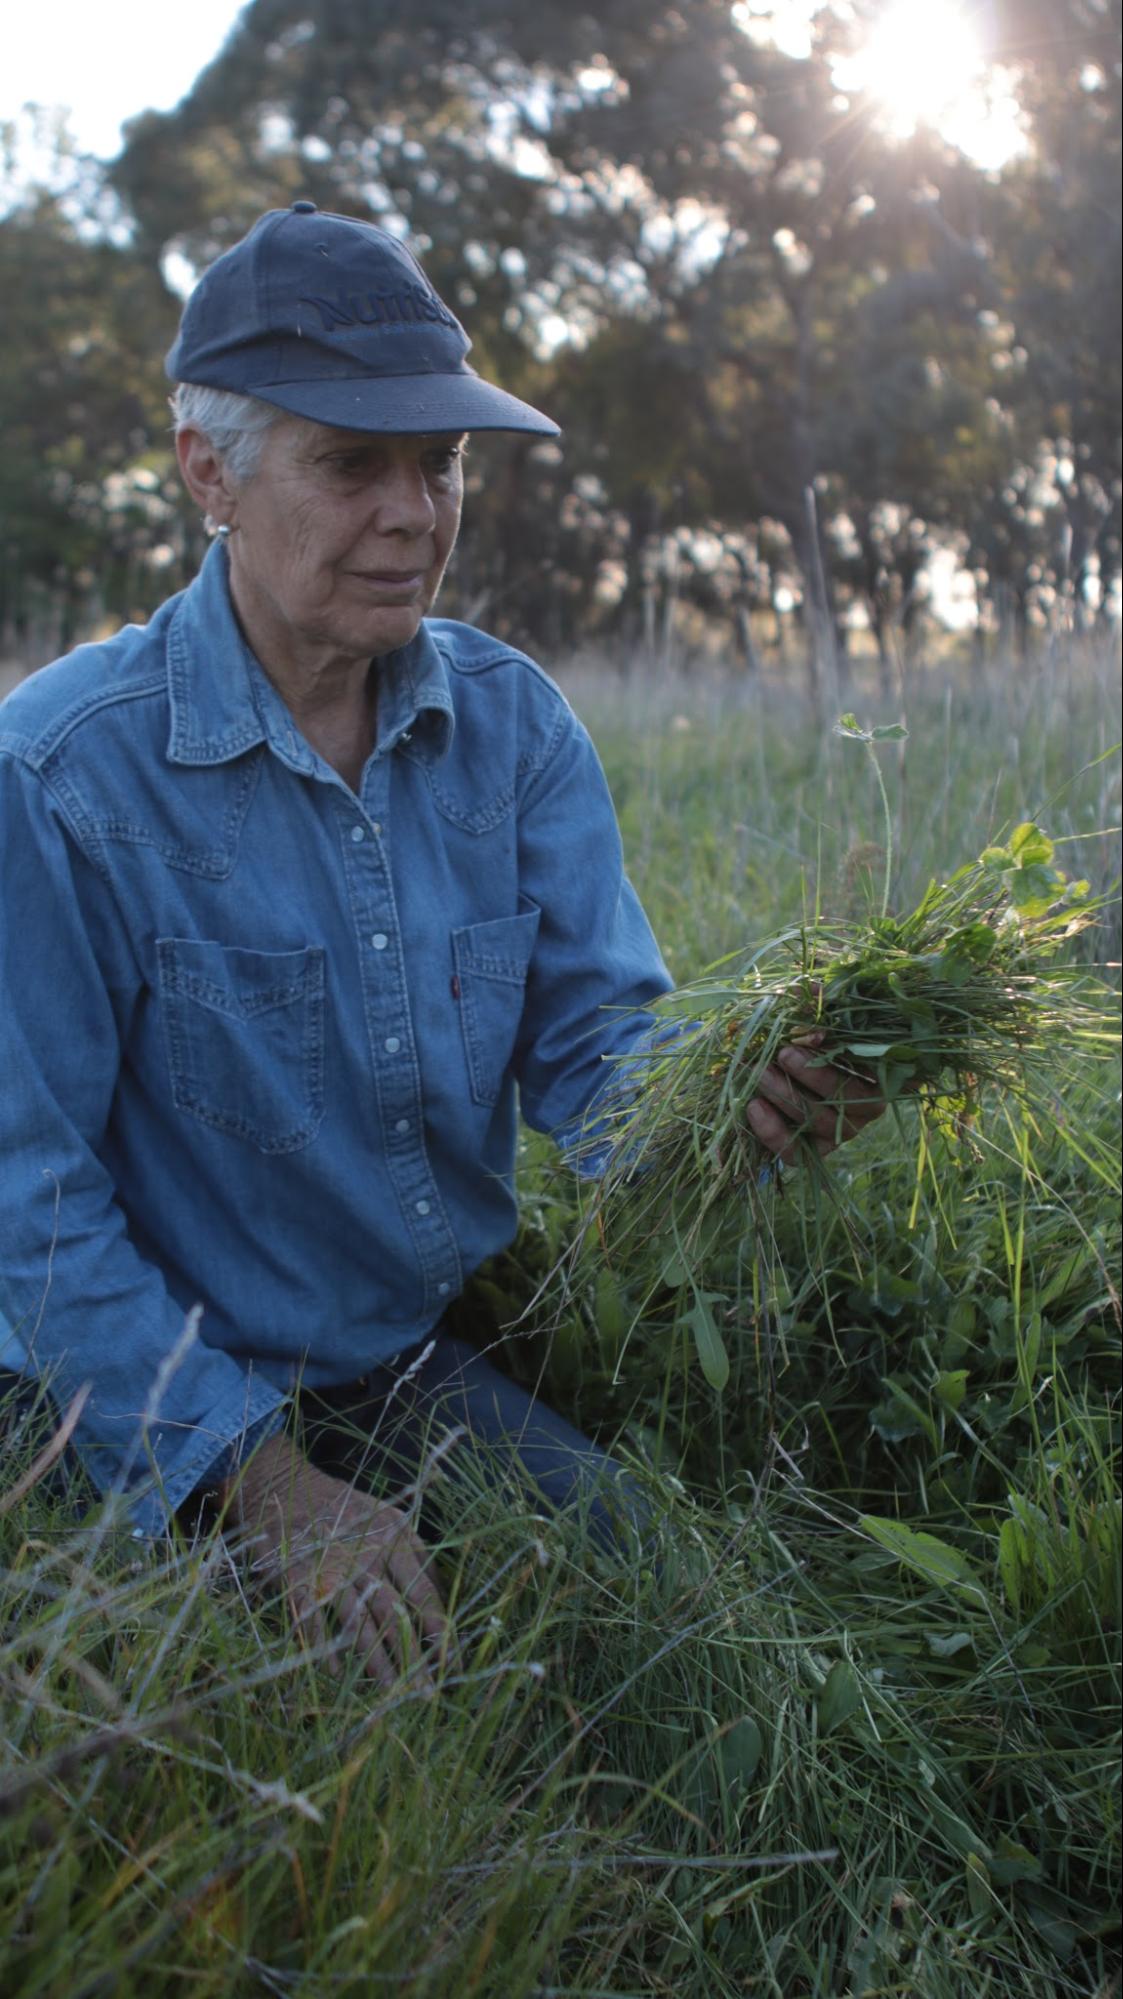
Image 18. Gillian Sanbrook calculating pasture quantity for feed budgeting at Bibbaringa. Source: Grow Love Project.
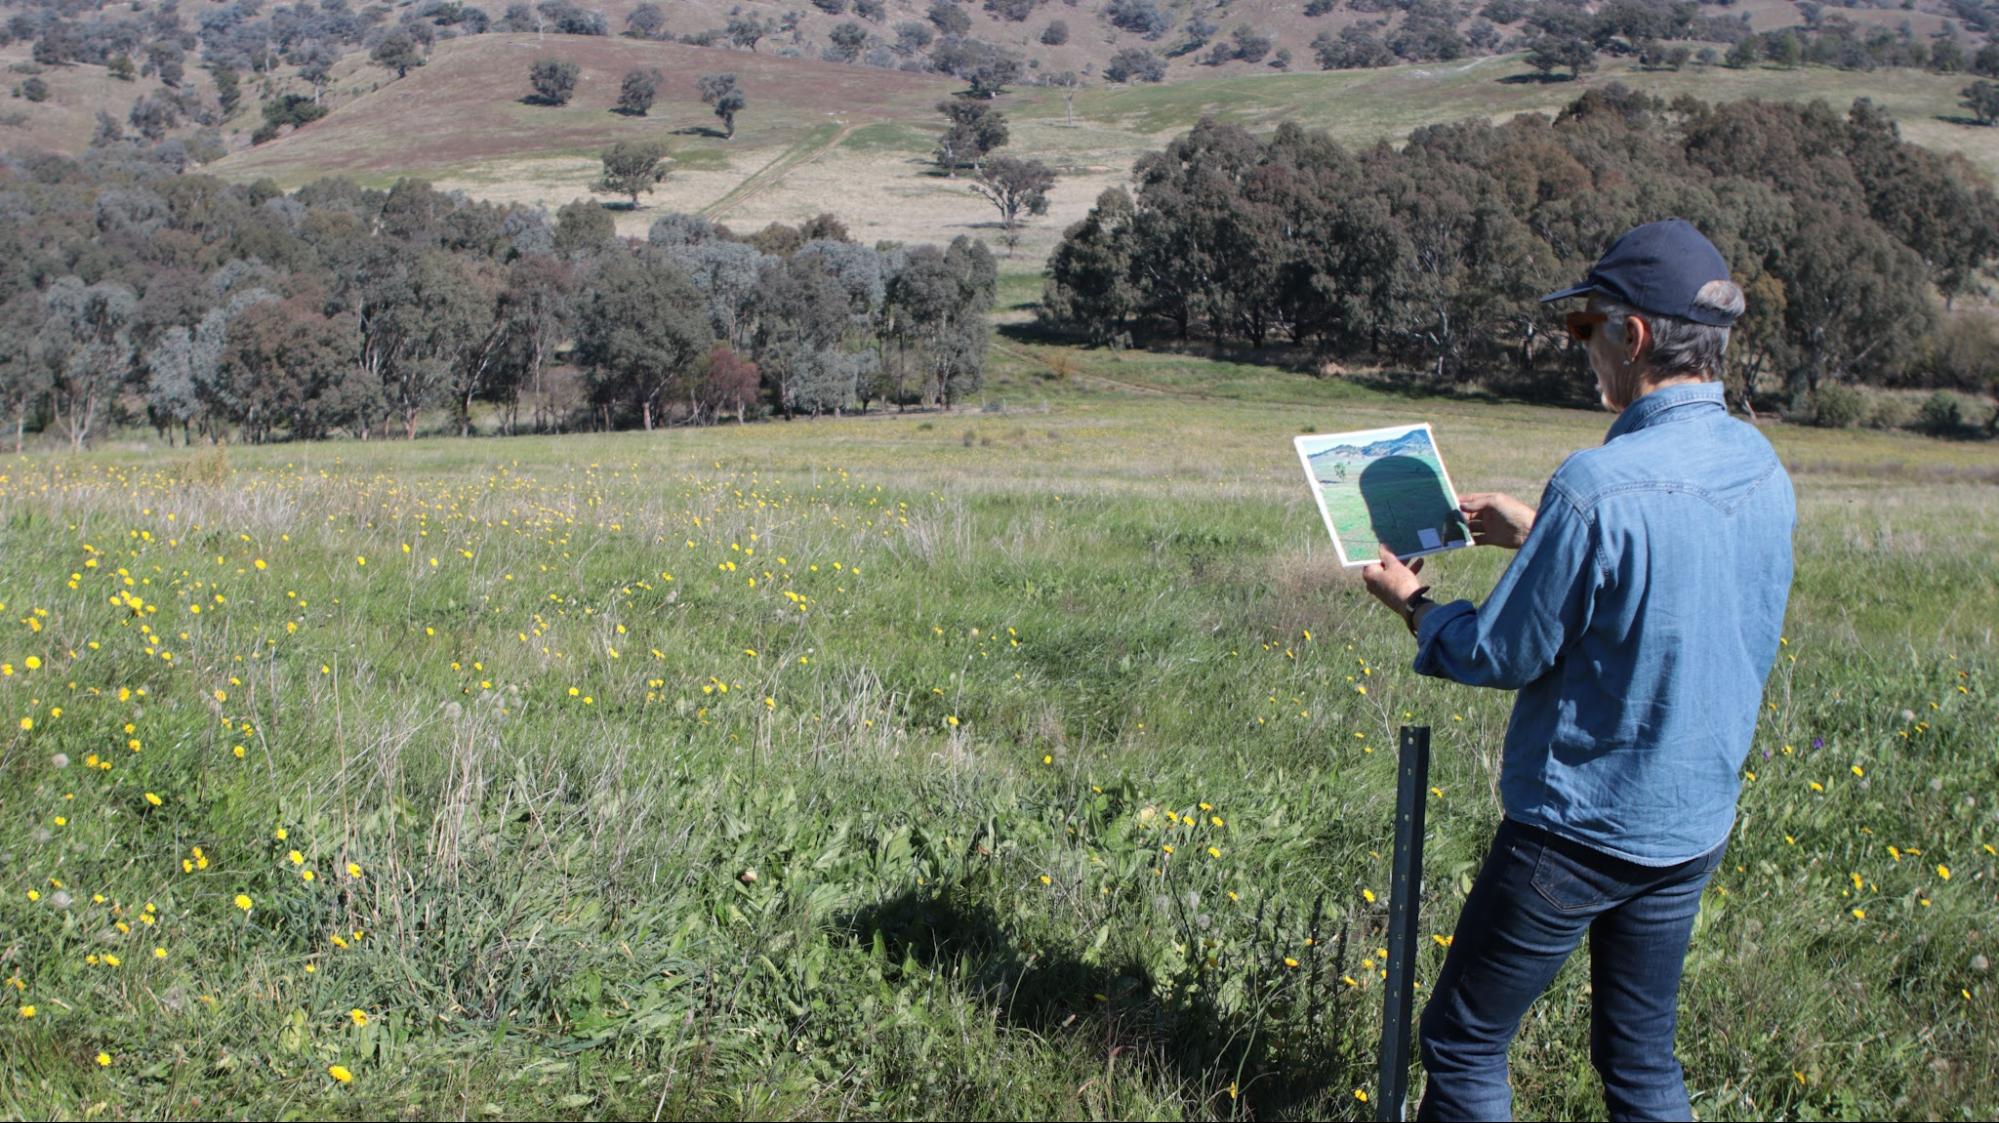
Image 19. Gillian Sanbrook comparing photos at a photo point monitoring site at Bibbaringa. Source: Grow Love Project.
Jake Ryan
Jake Ryan uses plant sap testing to inform foliar fertiliser applications on vegetable crops and to make sure his fertiliser formulations are working.
‘You can see results within a week of applying. We apply the foliar fertiliser, then take the sap test, get the results back and if that formulation does not work we tinker with it and go again,’ says Jake. Sap tests are sent to Novocrop in the Netherlands.
Jake has been sap testing now for three years on farm, and was tissue testing for 15 years prior to this. Jake changed to sap tests because he found they provided more accurate results. He does not see nutrient deficiencies show up in the tissue test as well as they do in the sap tests.
Jake says, ‘Using sap tests, you are normally seeing nutrient deficiencies 14 to 21 days before you see them in a tissue test. It will take me 10 days to get sap test results back, when I was doing tissue tests it would be 21 days, so you are picking things up before those symptoms are visible in tissue tests or visible by eye, so you can address them quickly.’
Jake takes Brix measurements as a rapid, practical field tool to complement sap testing. He uses the results to assess plant health, compare crop varieties, evaluate foliar spray ingredients and monitor relationships between plant sugar levels, pest resistance and nutrient balance.
Using sap testing and Brix together is working well for Jake. He says, ‘The sap testing has really helped to nail the foliar fertilisers, and we have seen Brix rise since using foliar fertilisers. Brix readings have increased from 2–5 to 7–9 consistently, with some crops reaching 10–14.’
Soil laboratory testing is also part of Jake’s monitoring program. Jake focuses on measuring base saturation, which is the percentage of the CEC that is saturated with calcium, magnesium, potassium and sodium ions,49P Hazelton and B Murphy, ‘Interpreting soil test results. What do all the numbers mean? Third Edition’, CSIRO Publishing, 2016. and uses this to determine and adjust liming rates.
Jake took the opportunity to do some soil biology testing for mycorrhizal fungi on the roots of his cereal crop following a brassica crop after 2.5 t of MAP50MAP is mono-ammonium phosphate, a fertiliser that supplies plants with phosphorus and nitrogen fertiliser had been applied. These tests indicated that after a brassica crop and phosphorus fertiliser applications, there was 70–80% colonisation of the roots with mycorrhizal fungi, a high result for vegetable growing.
How to interpret monitoring results
Soil, plant and landscape monitoring data fits together to build a holistic assessment of the condition of your land and the trends emerging over time as a result of your management practices. While empirical data on its own is important in monitoring, it is important to apply your observations and understanding of the landscape when interpreting results and drawing connections between the various pieces of data you’ve collected.
Look for trends against baseline measures
When tracking improvements in soil, crop and landscape health over time, look for trends over time in relation to groundcover, infiltration, earthworm numbers, root depth and the numbers of birds and insects. Stay alert for red flags that can indicate negative trends, like persistent erosion or poor recovery of pastures after grazing. All of these are clues that tell you how your landscape is responding to your management and in what direction things are moving.
💡 Tips and tricks: Always look for your gains
The Gap and the Gain principle51Dan Sullivan, ‘The Gap and The Gain’, 2020. encourages measuring progress against the baseline set when monitoring started. This helps highlight the gain in progress made towards a goal, rather than risk missing progress by focusing on the gap between the current and ideal situation. Focusing on the gain also helps build motivation and confidence when working towards the goals of improving soil, plant and landscape health.
Take a long-term approach
It can take time for changes to emerge in agricultural ecosystems, so be prepared to monitor as part of your long-term plan and make sure not to discount the value of monitoring if the data you collect is not what you expect.
Use monitoring resources to guide interpretation
There are a number of resources available as guides for interpreting monitoring results. Many of these resources offer a suggested scoring system for assessing physical soil health indicators in the field, which provides a consistent way to see trends in these results over time. When deciding which laboratory tests to use, it is important to understand how you will interpret and use the data. This might involve seeking advice from a professional service provider, or learning to interpret the results yourself through training or by researching methods outlined in some of the resources below.
👉 Find out more:
- Soil HASH 1 Manual includes a scoring system for recording soil physical health data.
- Northern Rivers Soil Health Card includes a results sheet with a scoring system.
- Visual Soil Assessment method includes a scoring system for recording soil and plant health indicators over time.
- Understanding your Soil Tests explains how to take a soil sample and how to interpret the results.
- Ag360 uses data from rainfall and pasture assessments to predict future pasture availability.
Integrate in-field assessments with laboratory tests
Looking at in-field data alongside laboratory test data can help reveal the connections between the two. For example, low organic carbon can be linked to poor soil structure and low biological activity. Tracking all of these together over time provides a more complete picture of soil health compared to tracking any one aspect alone. In-field assessments can change more quickly and therefore provide evidence of positive or negative trends that could be missed when looking at laboratory tests in isolation.
Using monitoring data to inform decision making
The real value comes from linking observations to management and treating monitoring as a process of measuring, recording, reflection and adjustment. Since you know your landscape better than anyone, interpret monitoring results alongside your knowledge of the land and your past and present management practices. Noticing how one paddock recovers faster than another after grazing, or how a particular paddock seems to be hit with less insect and disease pressure, can offer valuable insight for refining practices.
🥾 Tips from farmers: Bringing monitoring results into farm decision making
Michael Baldry
The monitoring data Michael Baldry has been collecting for the past five years has identified soil constraints including soil compaction and hard pans, slaking and soil structural issues. It has also identified areas with improved soil aggregation and differences in biological activity and numbers of earthworms. Michael’s next step is to focus on working with his soil advisor to identify underperforming paddocks, understand these soil constraints, use the data to plan pasture renovations and inform decisions about soil health improvements such as liming and cover crops. Michael suggests to ‘just start monitoring, you don’t have to do anything until you have three or four years of data, then you’ve got a picture of change or not, of progression or regression’ that can then be used to support your decision making.
Geoff has observed that rainfall variability strongly affects monitoring results, especially biological indicators, and explains that this needs to be taken into account when interpreting data that is used to guide farm management decisions.
Gillian Sanbrook
Gillian Sanbrook approaches monitoring as a deeply integrated part of her management approach. Monitoring is not simply data collection, but is part of an ongoing practice of observation, connection, decision making and adaptation.
The long-term trends in the data and her observations tell her ‘Bibbaringa is definitely improving. The colour of the soil has changed dramatically, it’s a richer and darker chocolate colour now.’ Gillian has also observed how in ‘the rocks and areas I couldn’t drive over previously, I can zoom over now because I am building organic matter in the soil’.
As the soil health and fertility is improving, the grasses Gillian records in her monitoring are improving in quality as well. ‘When I came here it was just Paterson’s curse (Echium plantagineum) and some ryegrass (Lolium spp.), now the perennials are coming back,’ Gillian explains. Gillian now observes microlaena (Microlaena stipoides), kangaroo grass (Themeda triandra), red grass (Bothriochloa macra), phalaris (Phalaris aquatica). ‘All the seeds are there and it is getting better all the time.’
Now Gillian has three years of data collected using the HASH method, she is starting to see more trends in her monitoring data. The HASH observations show that insect life is increasing. Gillian also notices that soil moisture is improving, which is effectively increasing the rate of recovery of pastures after grazing and helping them stay greener longer compared to those on other farms in the area.
Gillian uses the long-term trends she observes to guide management decisions, leading to significant positive outcomes over time, including improvements in water infiltration, quality of ground cover and increases in organic and humus layers, all of which have ‘revolutionised the overall performance at Bibbaringa’. For Gillian, monitoring is strongly linked with adaptive grazing management and long-term landscape regeneration. She says, ‘Monitoring is a way of thinking, it is so much about the decision-making process.’ Gillian explains that monitoring helps her respond more quickly to seasonal variability, make better grazing decisions and anticipate changes before they occur. ‘In April and November each year, I make a decision based on ground cover, weather forecasts, stock numbers and how much feed I have in front of me as to how I am going to approach the next six months. I can’t make a mistake because I always plan, monitor and replan. It is amazing how accurate you can be with my calls, I can see what is happening before it happens.’
Long-term grazing management that is informed by her observations and monitoring practices have resulted in darker soils, increased organic matter, improved perennial grass composition, higher moisture retention, greater biodiversity, including more birds, frogs and dung beetles, more wetlands and improved drought recovery.
Jake Ryan
Jake Ryan has learned through practice to interpret his plant sap tests and Brix testing to guide his decisions and fertiliser programs. The results are graphed so trends over time can show how things are changing. He also looks for observable improvements in pasture growth, soil structure and fertiliser requirements as evidence that soil health and nutrient cycling are improving.
After the vegetable crop phase in their rotation, the soil becomes hard due to the sodium in the irrigation water. After three to four years of pasture, the soil structure improves. Jake explains, ‘The quickest way to build soil is to feed the plant. The more photosynthesis, the higher the Brix levels, the more carbon pumps down, the more microbes it feeds, and the quicker you build that soil carbon and that soil life.’
Jake uses Brix testing to identify and select crop varieties with significantly lower pest pressure. ‘When we do variety trials, we test Brix to see how they compare to the other varieties for our environment. This helps us to decide which varieties we will choose in the future. A higher Brix means a higher chance of resistance to disease and pests. This year we decided to change to a new variety of green cabbage (Passat) with the highest Brix that had no pest or disease pressure.’
Brix testing also helps Jake trial foliar fertiliser formulations before applying them across pastures. Jake explains, ‘We take out different elements to test before applying a foliar nutrient application. We spray one square metre with one using the same water rate as the boom spray and test the Brix after 40 minutes to one hour. If the Brix has gone up, we will add this to the foliar spray, if the Brix has gone down, we will leave it out and if the Brix has not moved, we will put less of it in. We use this method to determine what we will spray the entire farm with in terms of foliar fertilisers.’
Further learning
Resources for further learning
- Photo point monitoring Fact sheet by NRM South
- Photo point monitoring guide by Healthy Land & Water
- How to install your own rangeland monitoring sites by Future Beef
- The Great Aussie EcoVineyards Earthworm Count: What, why, when and how to do an earthworm count.
- Assessing ground cover by Meat & Livestock Australia
- Slakes: free smartphone app: for instructions and analysing slaking test results
- Diagnosing soil compaction using a penetrometer by Penn State Extension
- Cotton strip test for soil biological activity: test instructions by NSW DPI
- Nutrient deficiency and toxicity charts by Montana State University
- How to assess legume nodulation by Meat & Livestock Australia
- A guide for fit-for-purpose soil sampling by Fertcare
- How to take a soil test by NSW Agriculture
Are we missing a great learning resource here? Let us know via [email protected].
What did you think of this guide?
Thank you for reading the practice guide! We would love to know whether you found the guide useful. Please take a minute to tell us more.
For more information
If you have any questions, get in touch at [email protected].
